Where Data Tells the Story
© Voronoi 2026. All rights reserved.
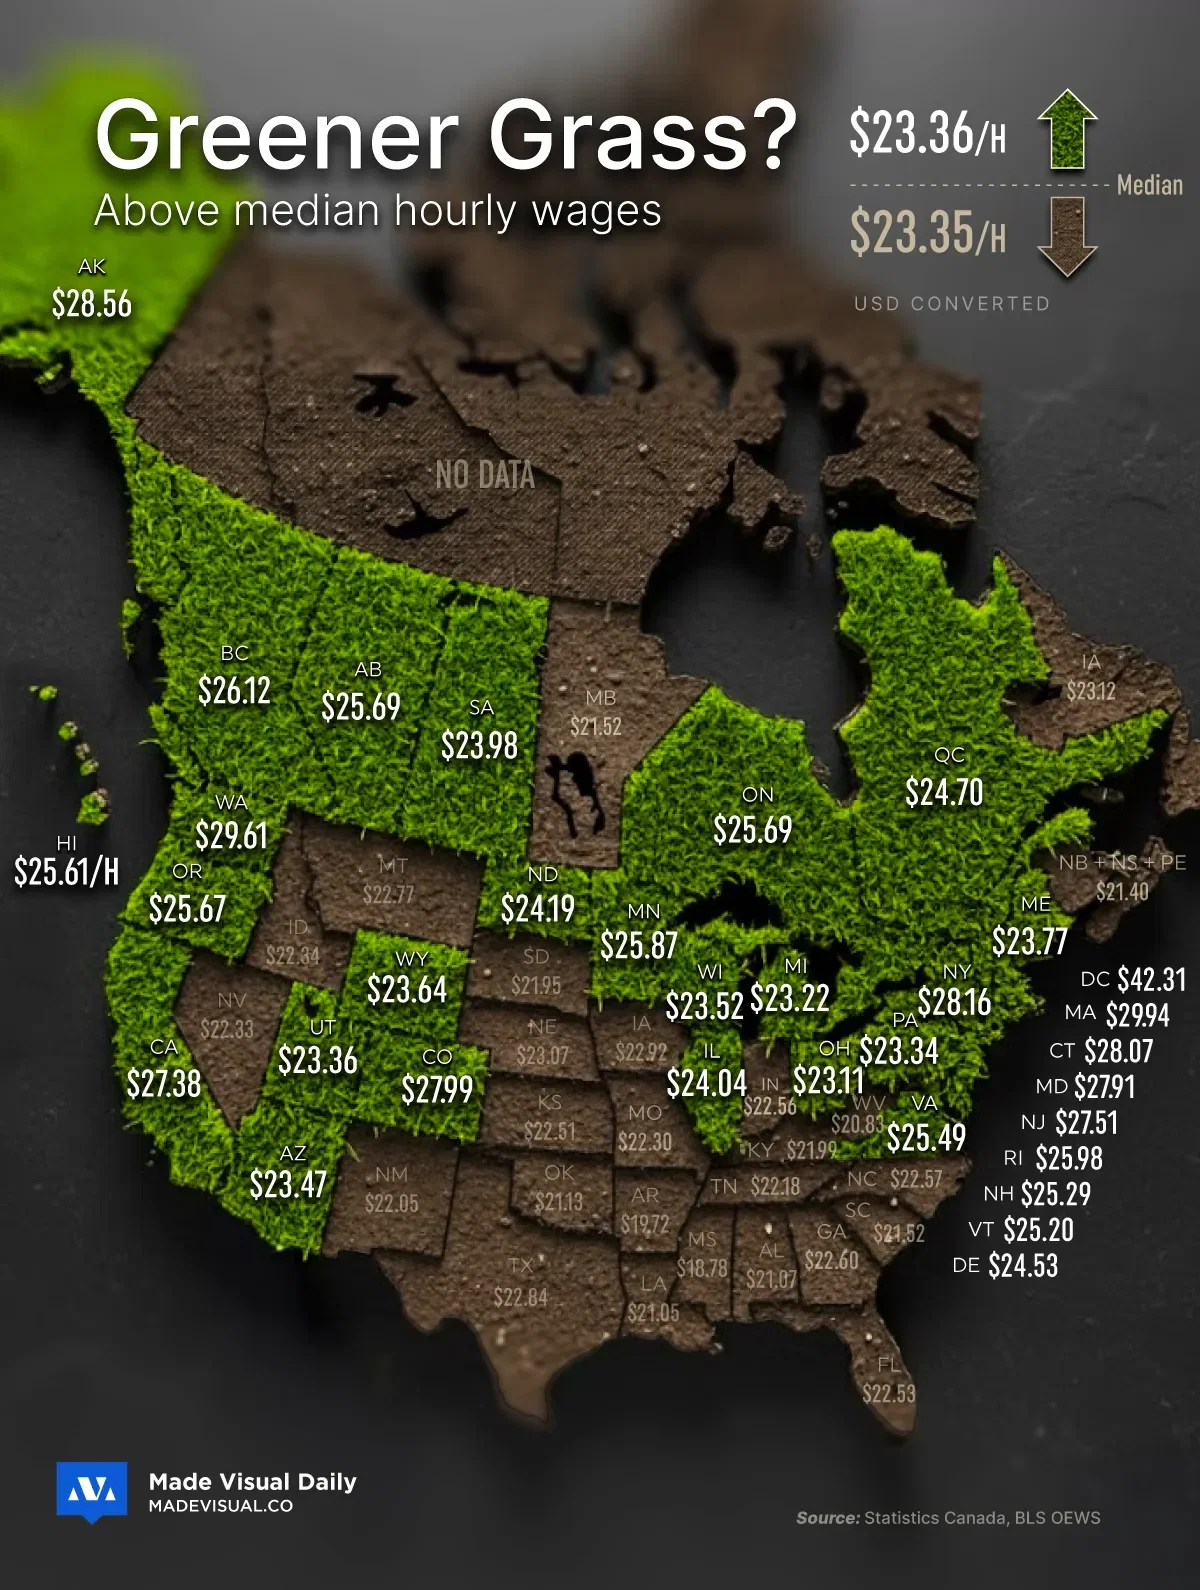
Using the latest figures from the U.S. Bureau of Labor Statistics and Statistics Canada, this map compares median hourly wages across every state and province, revealing where the grass—and the paychecks—are truly greener.
Data note: This analysis uses median hourly wage data for all occupations from the U.S. Bureau of Labor Statistics (May 2024) and Statistics Canada’s 2025 LMIA provincial medians, converted into U.S. dollars using the October 2025 exchange rate (1 CAD = 0.7136 USD). Figures reflect the midpoint of pay across each region, making them a fairer comparison than averages and highlighting where an hour of work is genuinely worth more.
💡 1. The median U.S. worker earns about $24 per hour, meaning half of Americans make less than roughly $50,000 a year before taxes.
🇨🇦 2. Converted to USD, Canada’s national median hourly wage sits near $23, placing it almost neck-and-neck with the U.S. median.
🏙️ 3. Workers in the District of Columbia make nearly 80% more per hour than those in Mississippi—the largest pay gap in the country.
⚡ 4. In both nations, energy and tech hubs (like Alberta, Washington, and California) consistently top the wage rankings, showing how innovation economies pull up local pay.
🌾 5. Rural regions across the Great Plains and Atlantic Canada trail by more than $10 an hour, underscoring how location still defines opportunity in 2025.