WealthSep 12, 2024
Visualizing Wealth Inequality in 2023 ⚖️
What We're Showing
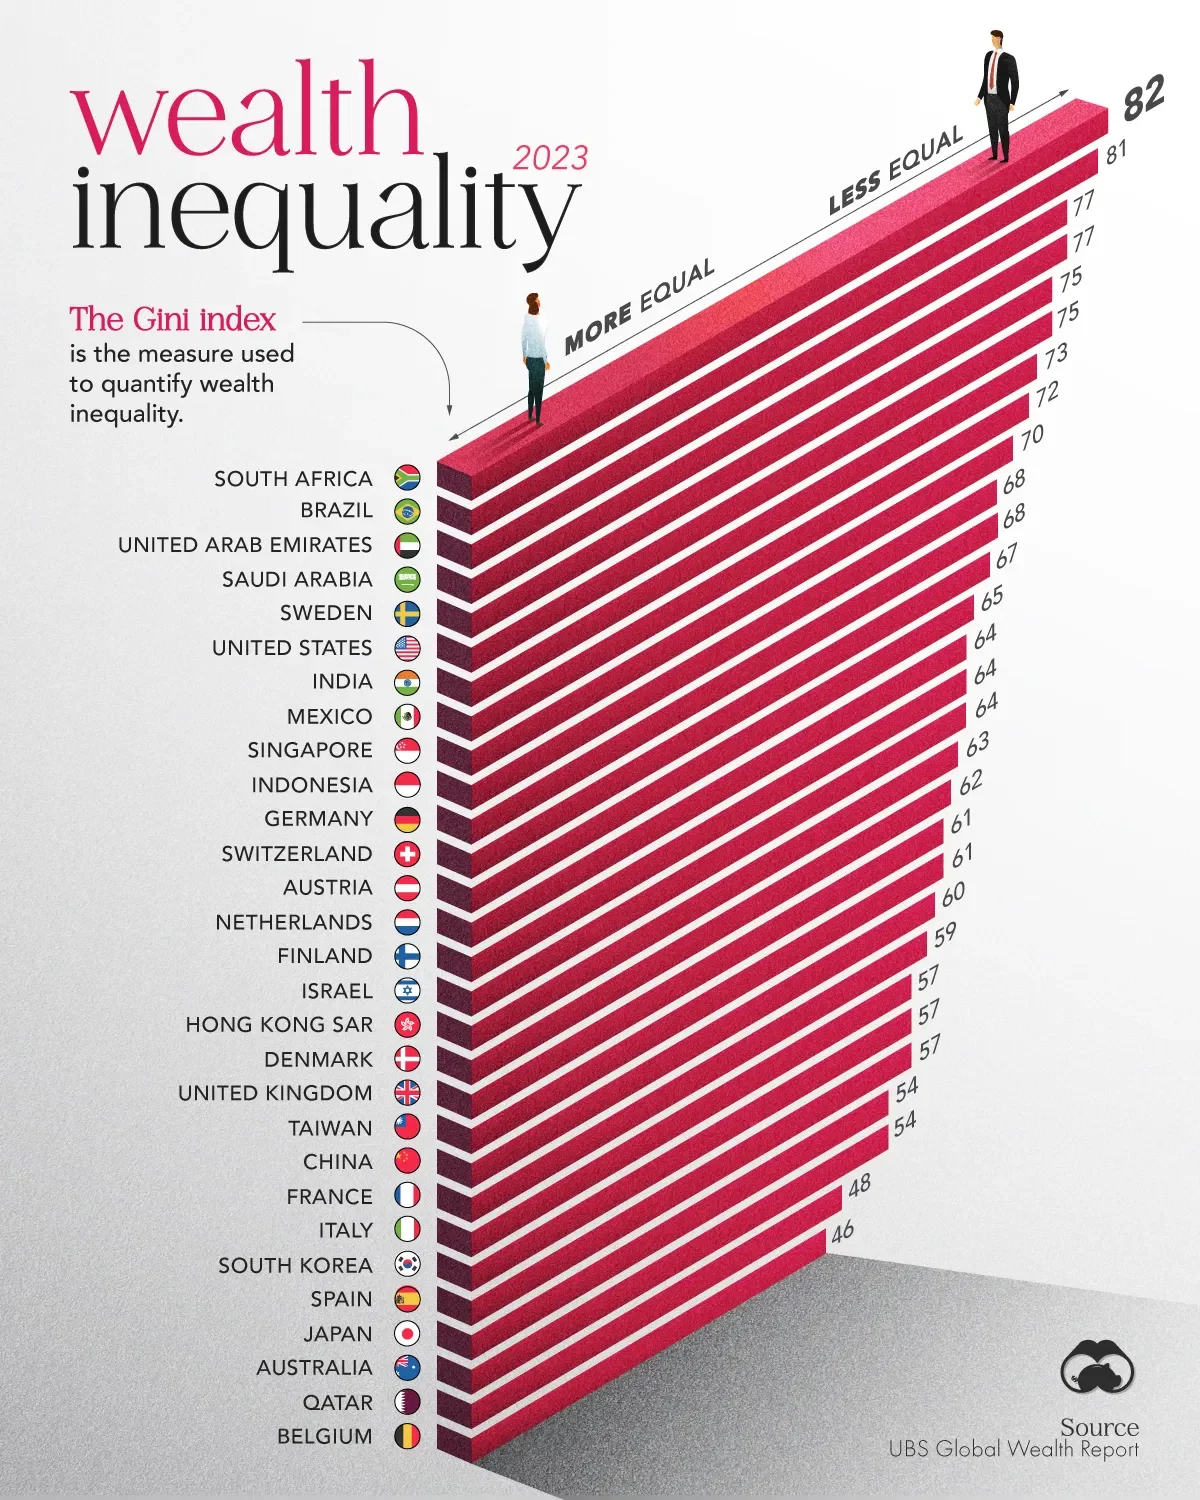
The wealth inequality of a selected number of countries as measured by the Gini index.
Figures come from the UBS Global Wealth Report 2024.
About the Gini Index
The Gini Index quantifies the wealth disparity between the richest and poorest members of society. A score of zero represents perfect equality (everyone has equal wealth) and 100 represents perfect inequality (one person has all the wealth, and everyone else has none).
The index is calculated by comparing the current cumulative income distribution to a scenario of perfect equality, with the difference between these two distributions representing the extent of inequality.
Key Takeaways
- Some of the world's wealthiest economies, like the United States and the United Arab Emirates, rank high in terms of wealth inequality, suggesting that even in prosperous countries, wealth distribution is highly uneven.
- Despite being a social democracy with a strong welfare state, Sweden has a high Gini index. Some researchers have attributed the growing inequality in Sweden to tax policies favourably skewed towards high-income earners that have not been successful in combating economic inequality.
Dataset
Country | Gini index score in 2023 |
---|---|
South Africa | 82 |
Brazil | 81 |
United Arab Emirates | 77 |
Saudi Arabia | 77 |
Sweden | 75 |
United States | 75 |
India | 73 |
Mexico | 72 |
Singapore | 70 |
Indonesia | 68 |
Germany | 68 |
Switzerland | 67 |
Austria | 65 |
Netherlands | 64 |
Finland | 64 |
Israel | 64 |
Hong Kong SAR | 63 |
Denmark | 62 |
United Kingdom | 61 |
Taiwan | 61 |
Mainland China | 60 |
France | 59 |
Italy | 57 |
Korea | 57 |
Spain | 57 |
Japan | 54 |
Australia | 54 |
Qatar | 48 |
Belgium | 46 |
138
0
33.0K