WealthSep 3, 2024
Visualizing Wealth Growth by Country đź’¸
What We’re Showing
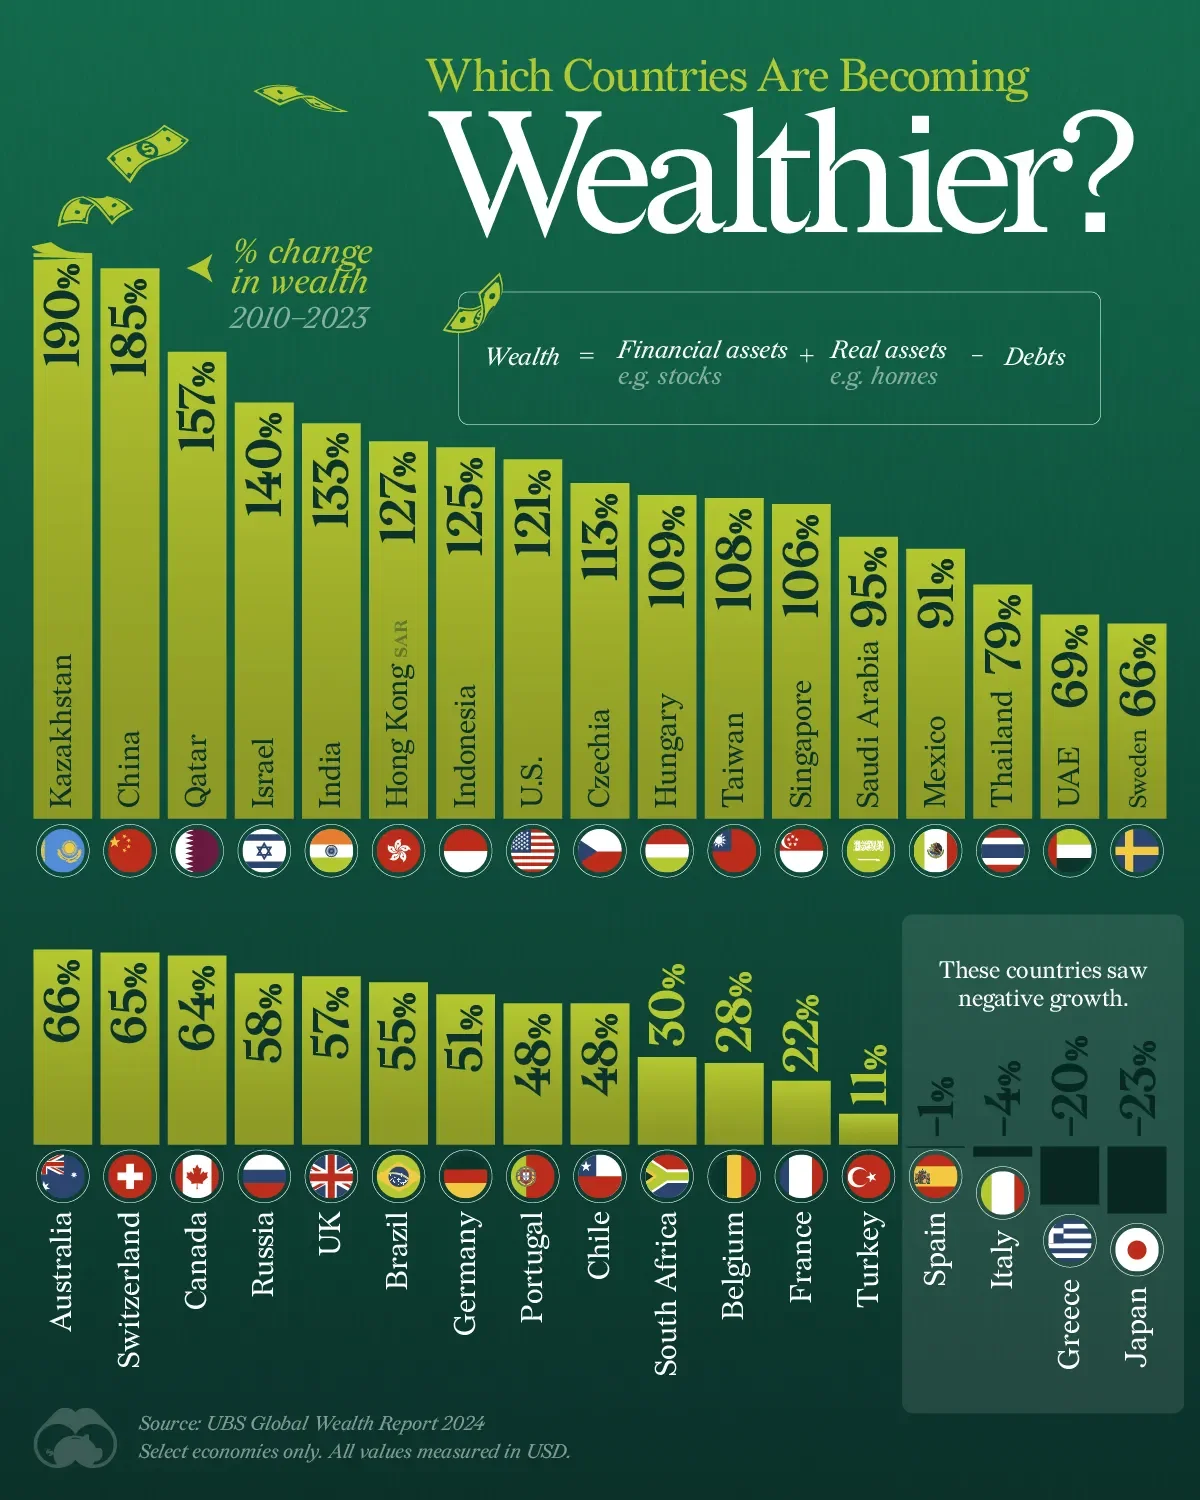
This graphic shows the average wealth (net worth) growth by country, from 2010 to 2023. This data comes from the UBS Global Wealth Report 2024.
See the Dataset tab for additional CAGR figures.
How is “Wealth” Measured?
UBS defines wealth as the value of financial assets (e.g. stocks) plus real assets (e.g. homes) owned by households, minus their debts. This is also known as “net worth”.
Key Takeaways
- Among this sample of countries, wealth grew the fastest in Kazakhstan. The country is a major producer of oil, uranium, and other resources.
- Meanwhile, just four countries saw negative wealth growth over the time period: Spain, Italy, Greece, and Japan.
Dataset
Country | % Change in Wealth (2010-2023) | 2010-2023 CAGR (%) |
---|---|---|
Kazakhstan | 190 | 9 |
China | 185 | 8 |
Qatar | 157 | 8 |
Israel | 140 | 7 |
India | 133 | 7 |
Hong Kong | 127 | 7 |
Indonesia | 125 | 6 |
U.S. | 121 | 6 |
Czechia | 113 | 6 |
Hungary | 109 | 6 |
Taiwan | 108 | 6 |
Singapore | 106 | 6 |
Saudi Arabia | 95 | 5 |
Mexico | 91 | 5 |
Thailand | 79 | 5 |
UAE | 69 | 4 |
Sweden | 66 | 4 |
Australia | 66 | 4 |
Switzerland | 65 | 4 |
Canada | 64 | 4 |
Russia | 58 | 4 |
UK | 57 | 4 |
Brazil | 55 | 3 |
Germany | 51 | 3 |
Portugal | 48 | 3 |
Chile | 48 | 3 |
South Africa | 30 | 2 |
Belgium | 28 | 2 |
France | 22 | 2 |
Turkey | 11 | 1 |
Spain | -1 | 0 |
Italy | -4 | 0 |
Greece | -20 | -2 |
Japan | -23 | -2 |
Data sources
Select economies only. All values measured in USD.
163
0
44.7K