Jan 23, 2024
The Top 10% Richest Own Two Thirds of All Household Wealth in the U.S.
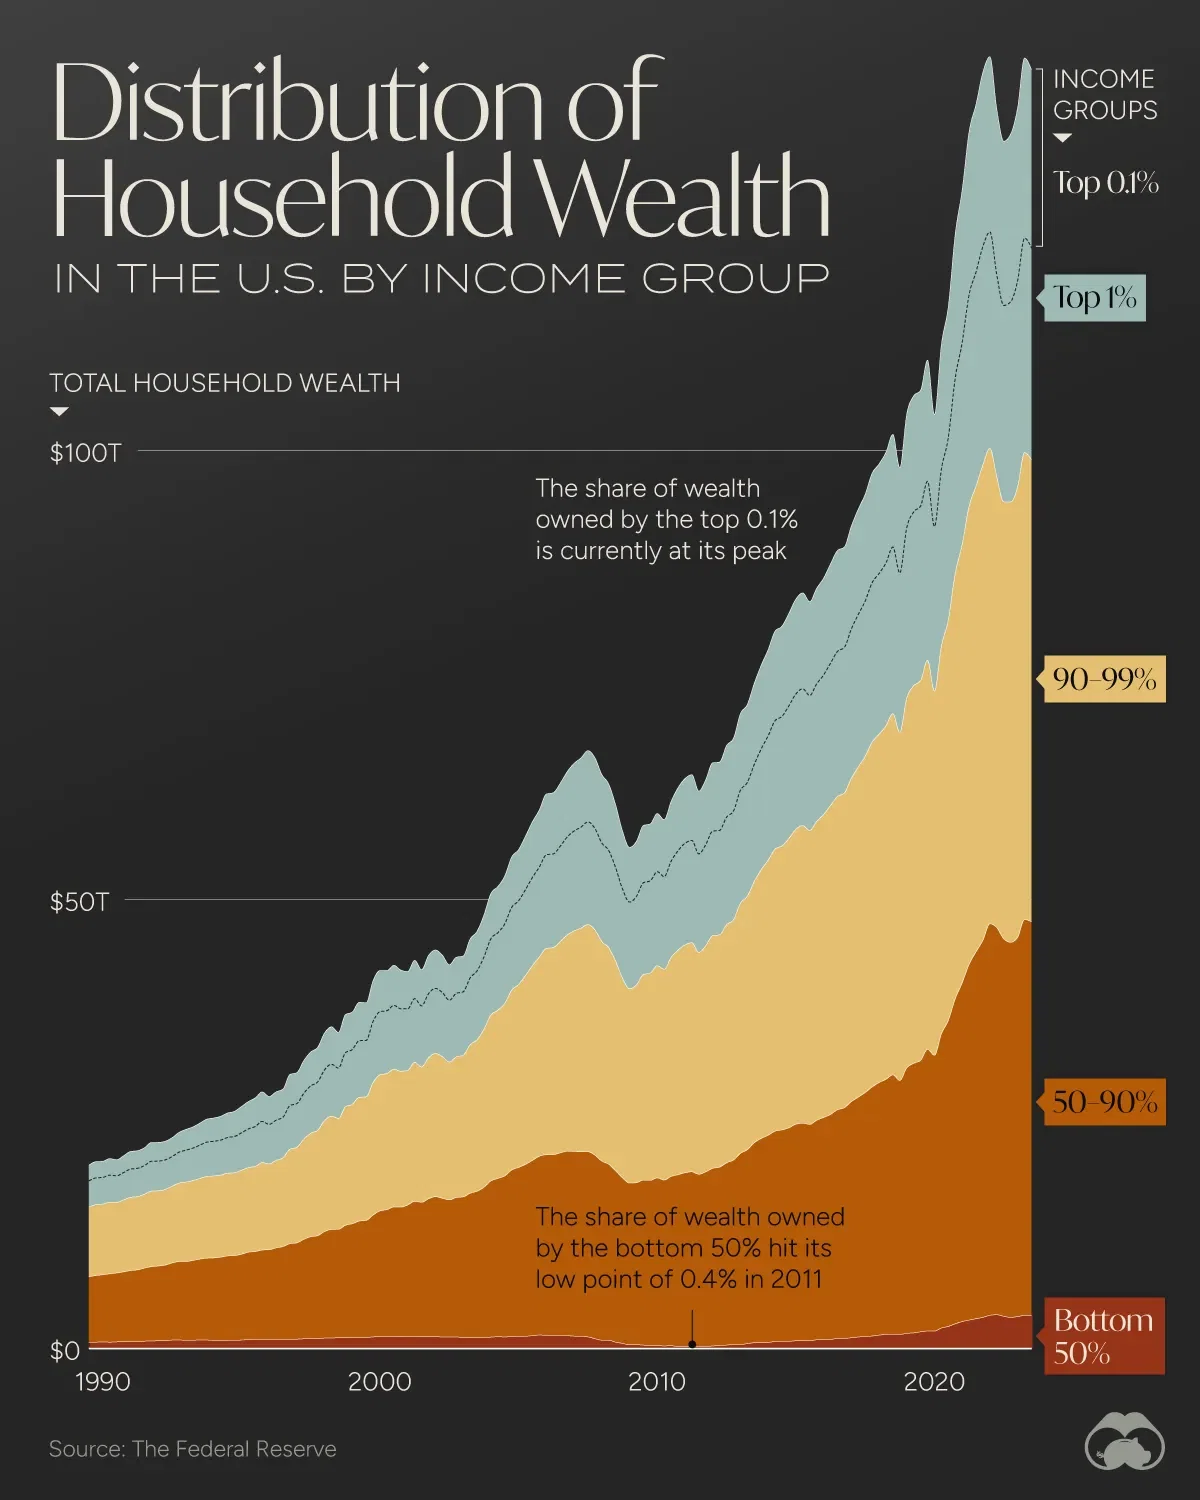
What We’re Showing
How household wealth is distributed between different income groups in the U.S. from 1989 to today.
Data Highlights
- The amount of household wealth owned by the bottom 50% was at its high point (3.8%) in 1993, and reached a low point (0.4%) in 2011
- The share of wealth held by the richest 0.1% is currently at its peak
Additional Context
- The top asset category for the richest 0.1% is corporate equities and mutual funds, which make up over one third of their wealth
- The top asset category for the bottom 50% is real estate, which makes up half of their household wealth