
Where Data Tells the Story
© Voronoi 2026. All rights reserved.

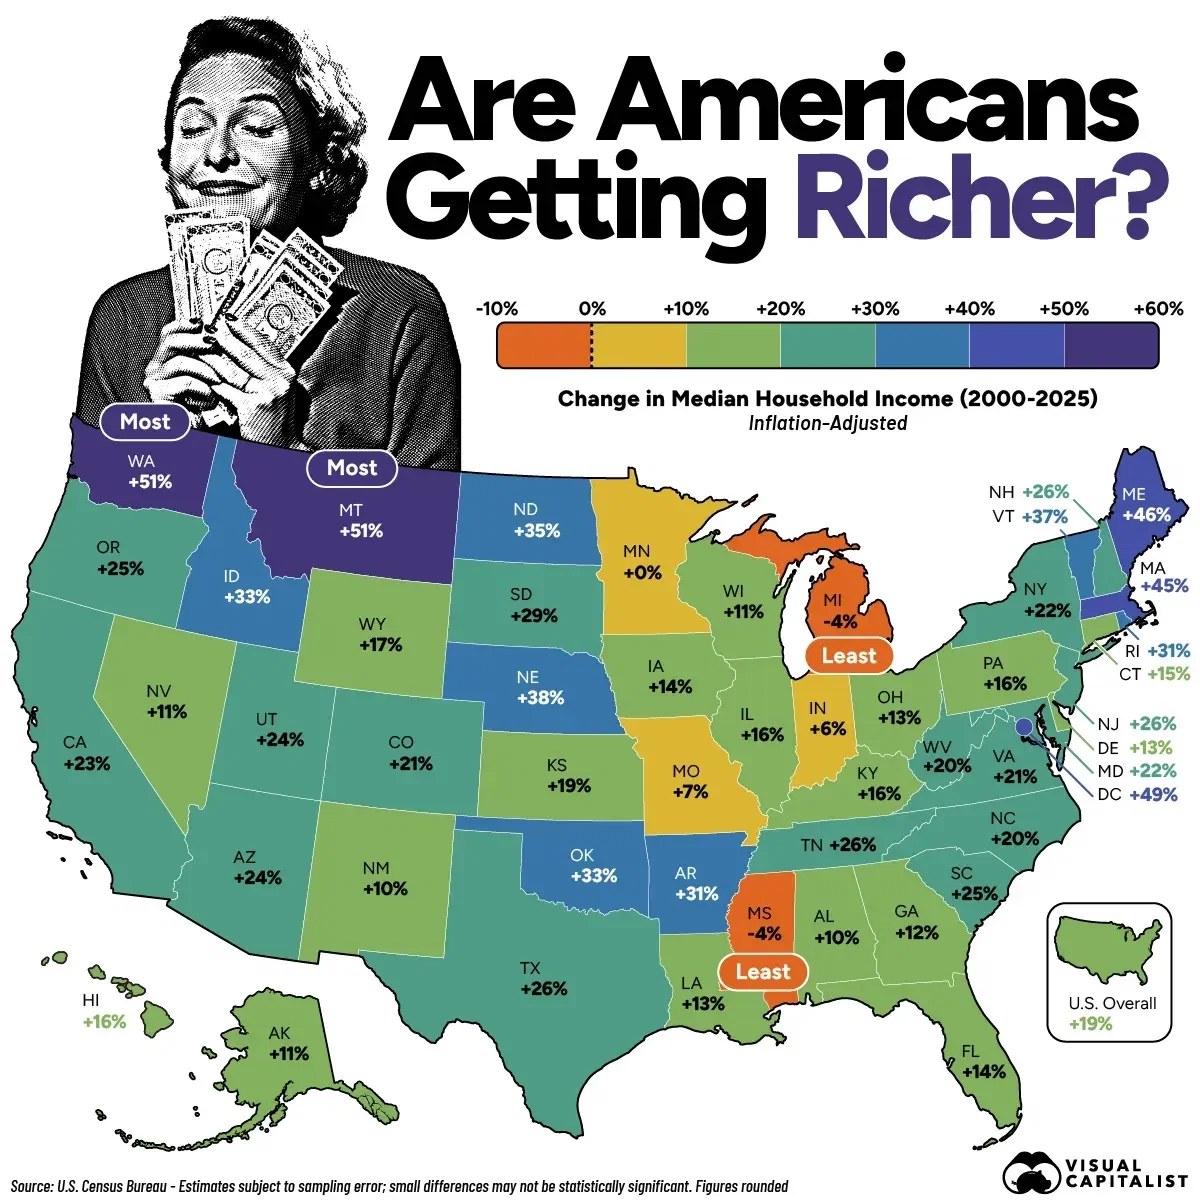
Are Americans really better off than they were 25 years ago?
Rising incomes tell only part of the story. After accounting for inflation, households in some states have seen substantial gains in purchasing power, while others have experienced stagnation or declines.
This map shows how inflation-adjusted median household income changed across all 50 states and Washington, D.C., from 2000 to 2025, based on data from the U.S. Census Bureau.
Read the full article here.