
Where Data Tells the Story
© Voronoi 2026. All rights reserved.

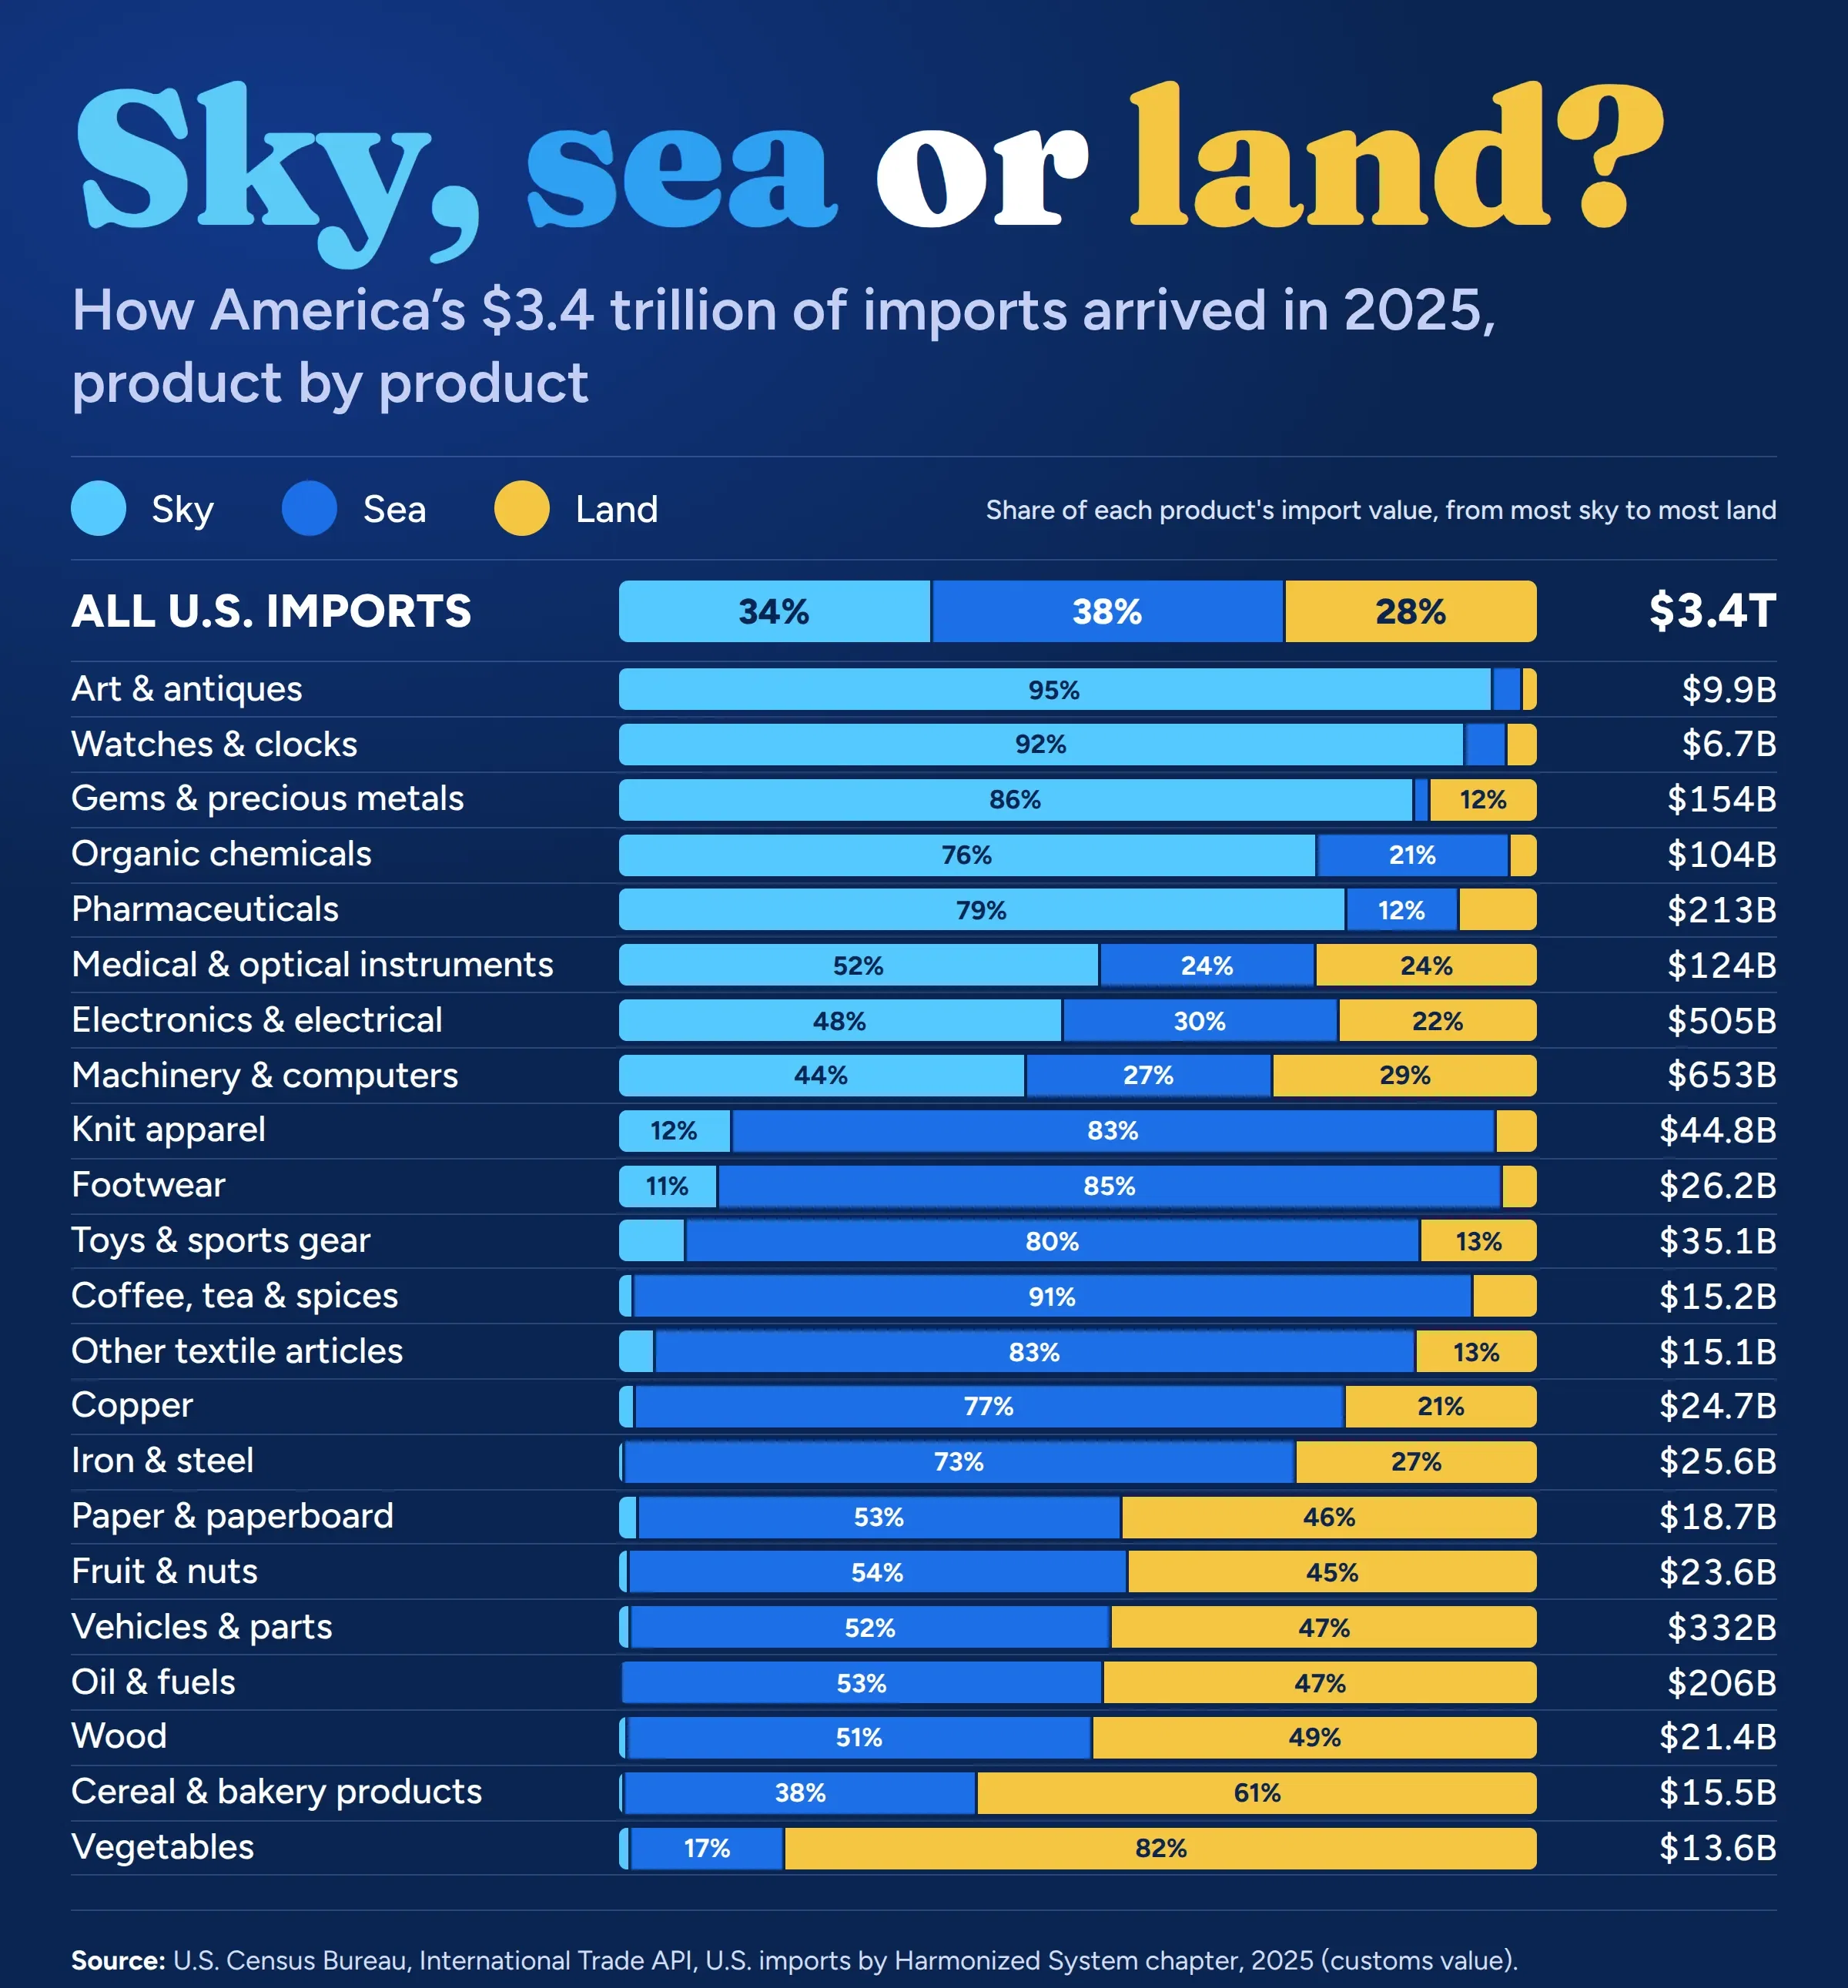
Every year, the U.S. imports trillions of dollars in goods, and how each shipment travels, by plane, ship, or truck and rail, varies widely by product. This visualization uses 2025 U.S. Census trade data to break down 22 major import categories by transport mode.
High-value, low-bulk goods fly: art and antiques (95% by air), watches (92%), gems and precious metals (86%), and pharmaceuticals (79%). Bulkier consumer goods move by sea: footwear (85%), knit apparel (83%), and coffee (91%). And goods from neighboring countries move by land: vegetables (82%) and cereal and bakery products (61%) arrive mostly by truck, rail, or pipeline from Canada and Mexico.
Overall, air shipments carried 34% of import value, sea 38%, and land 28%.