
Where Data Tells the Story
© Voronoi 2026. All rights reserved.

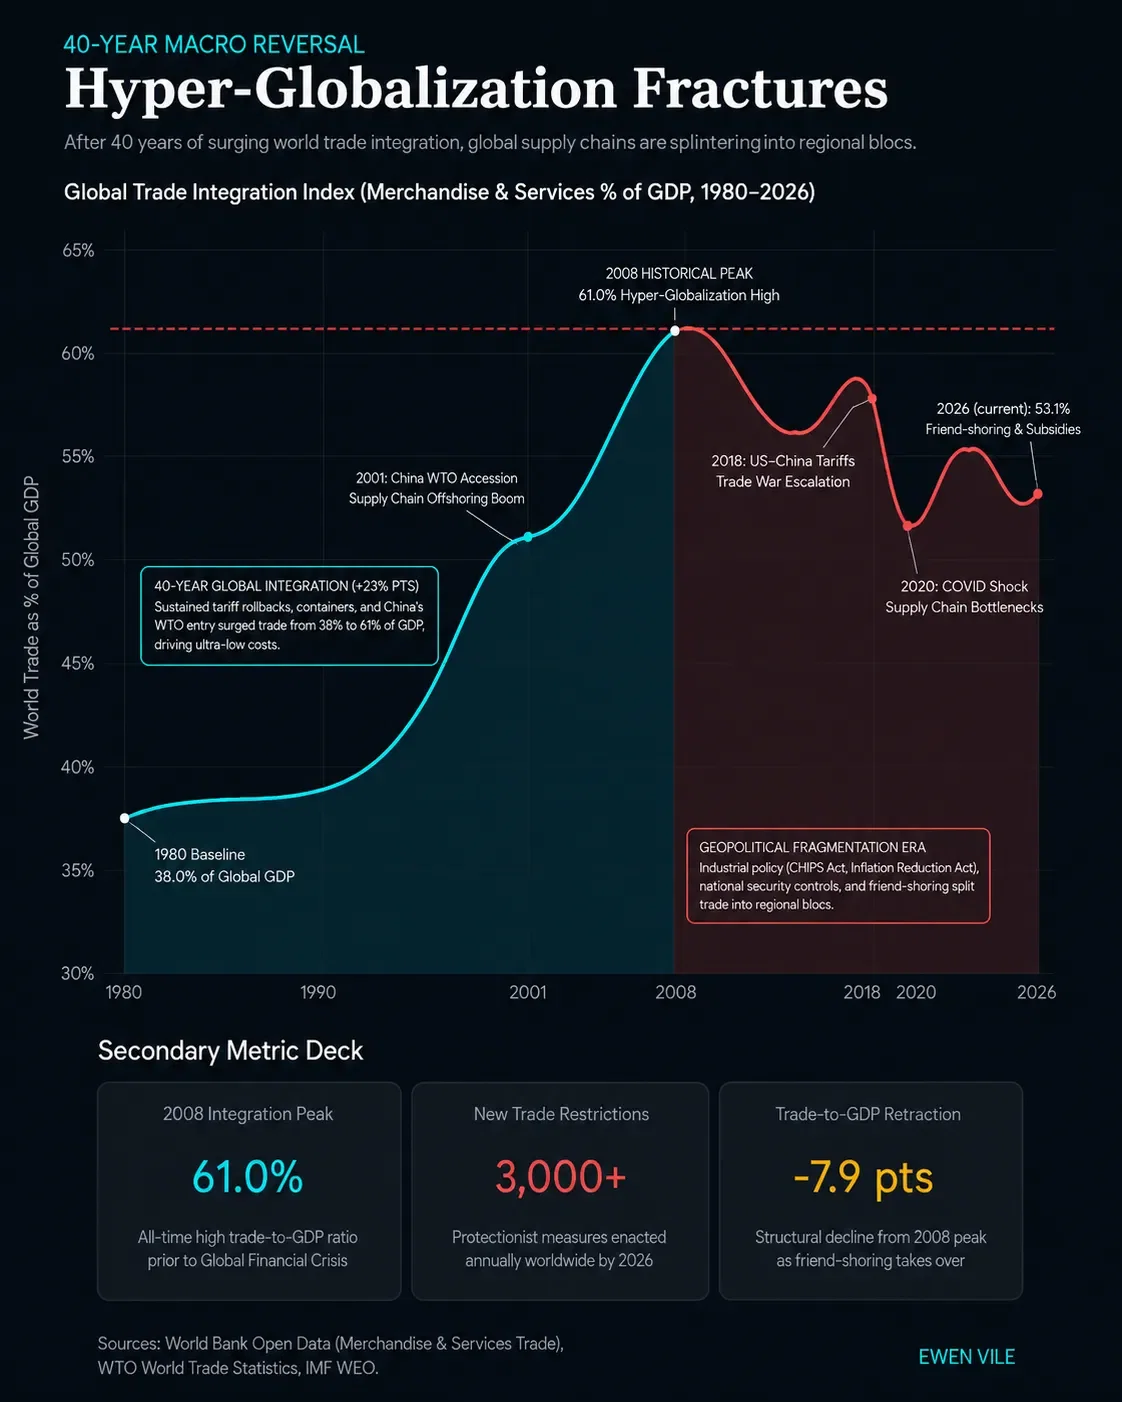
Four Decades of Global Trade Integration Reverses into Regional Blocs (1980–2026)
For four decades (1980–2008), the global economy operated under a single overriding imperative: hyper-globalization. Driven by containerization, tariff reductions, and China's 2001 WTO accession, world trade as a share of global GDP surged from 38.0% in 1980 to an all-time peak of 61.0% in 2008. That multi-decade integration era optimized global manufacturing for absolute cost efficiency, establishing sprawling cross-border supply chains. Between 2008 and 2026, that 40-year trend officially reversed. Following the 2008 financial crisis, the 2018 US-China tariff escalations, COVID-19 supply disruptions, and the rise of national industrial policies (such as the U.S. CHIPS Act and EU Green Deal), hyper-globalization fractured. World trade has retracted to 53.1% of GDP as nations prioritize resilience, national security, and "friend-shoring" over minimum-cost efficiency. KEY METRICS & HIGHLIGHTS: • 2008 Integration Peak: 61.0% of GDP (All-time high trade-to-GDP ratio) • 40-Year Expansion (1980–2008): +23.0 Percentage Points (Trade integration boom) • Current Level (2026): 53.1% of GDP (-7.9 pts retraction from 2008 peak) • New Trade Restrictions: 3,000+ protectionist measures enacted annually worldwide