Where Data Tells the Story
© Voronoi 2026. All rights reserved.
2025 has been a difficult year for international trade, marked by heightened uncertainty and renewed conflict across major economies. Much of this volatility has stemmed from U.S. trade policy, which has been increasingly oriented toward narrowing its large goods trade deficit.
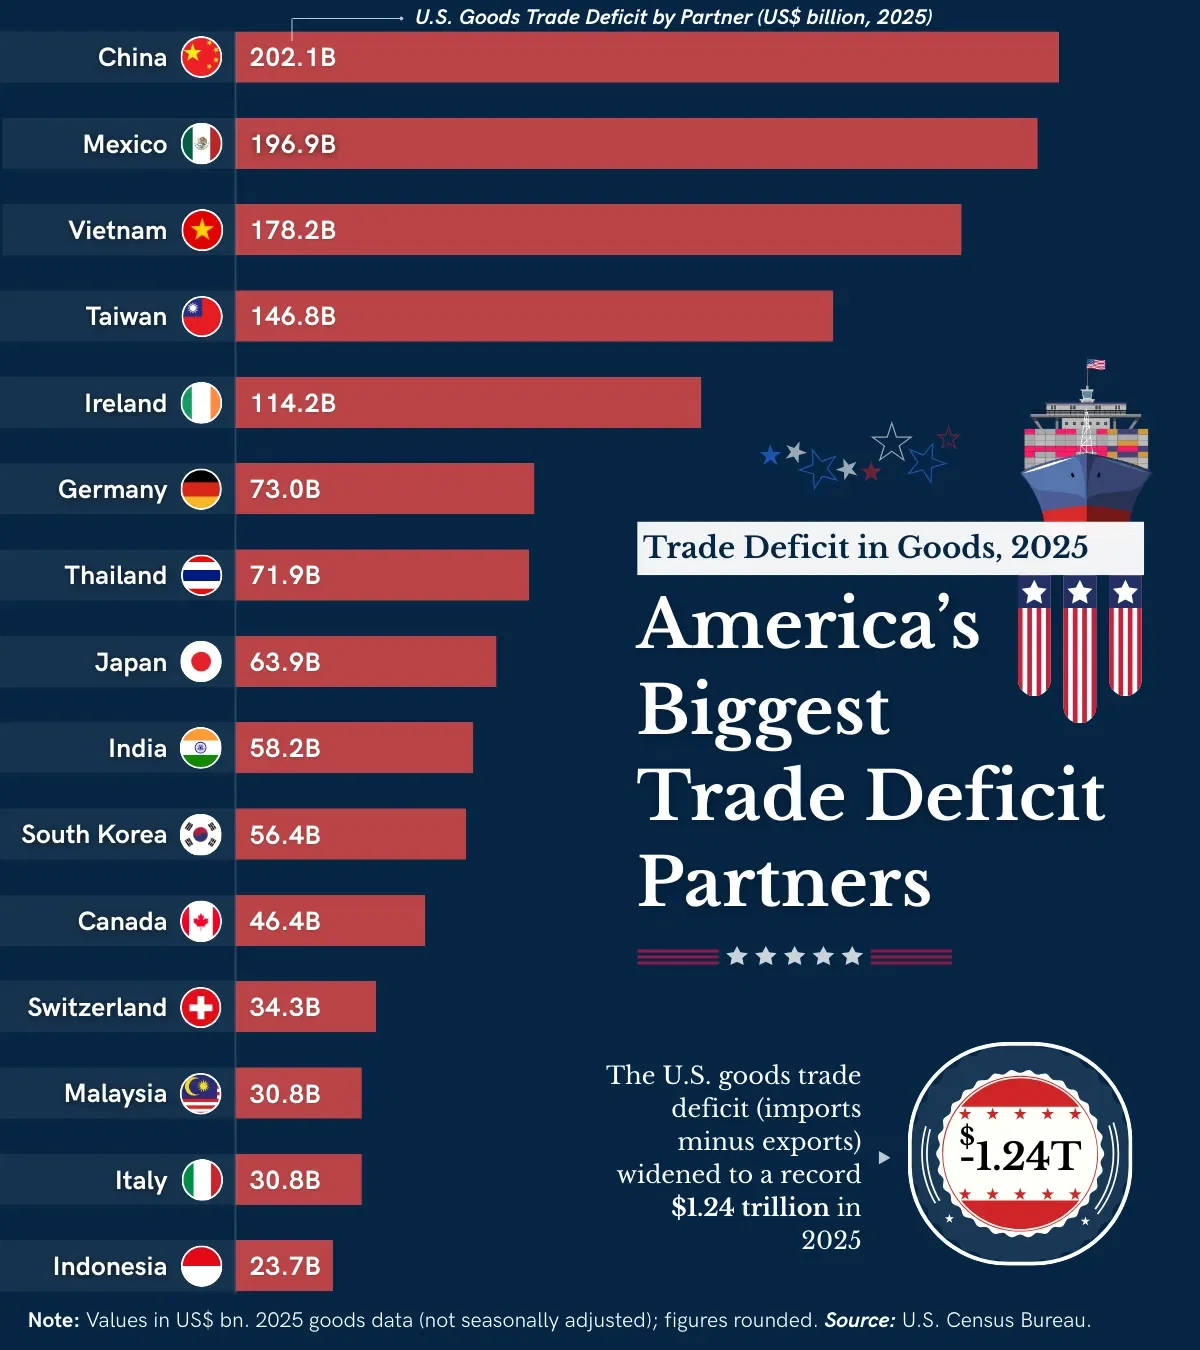
Yet despite tariffs and the proliferation of non-tariff barriers, the U.S. goods trade deficit widened further in 2025 - reaching a record $1.24 trillion. The latest data suggest that policy tightening alone has not been sufficient to materially alter underlying trade dynamics.
Global trade this year unfolded against a complex backdrop of slowing growth, supply-chain realignment, and geopolitical fragmentation. While measures were introduced to curb imports and rebalance trade flows, structural factors - including consumer demand, production specialisation, and supply-chain diversification - continued to shape outcomes.
Based on 2025 goods trade data from the U.S. Census Bureau, this chart ranks America’s largest trade deficit partners - highlighting the economies where imports exceeded exports by the widest margins.
Key takeaways from the data are:
More importantly, Asian economies account for a substantial share of the U.S. goods trade deficit in 2025 - pointing to an increasingly Asia-centric trade imbalance and the continued emergence of China+1 supply-chain dynamics.
Note: Trade deficit refers to the value of goods imports exceeding goods exports (imports minus exports). Values shown in US$ billion. 2025 data are not seasonally adjusted; figures rounded.
Source: U.S. Census Bureau.