Where Data Tells the Story
© Voronoi 2026. All rights reserved.
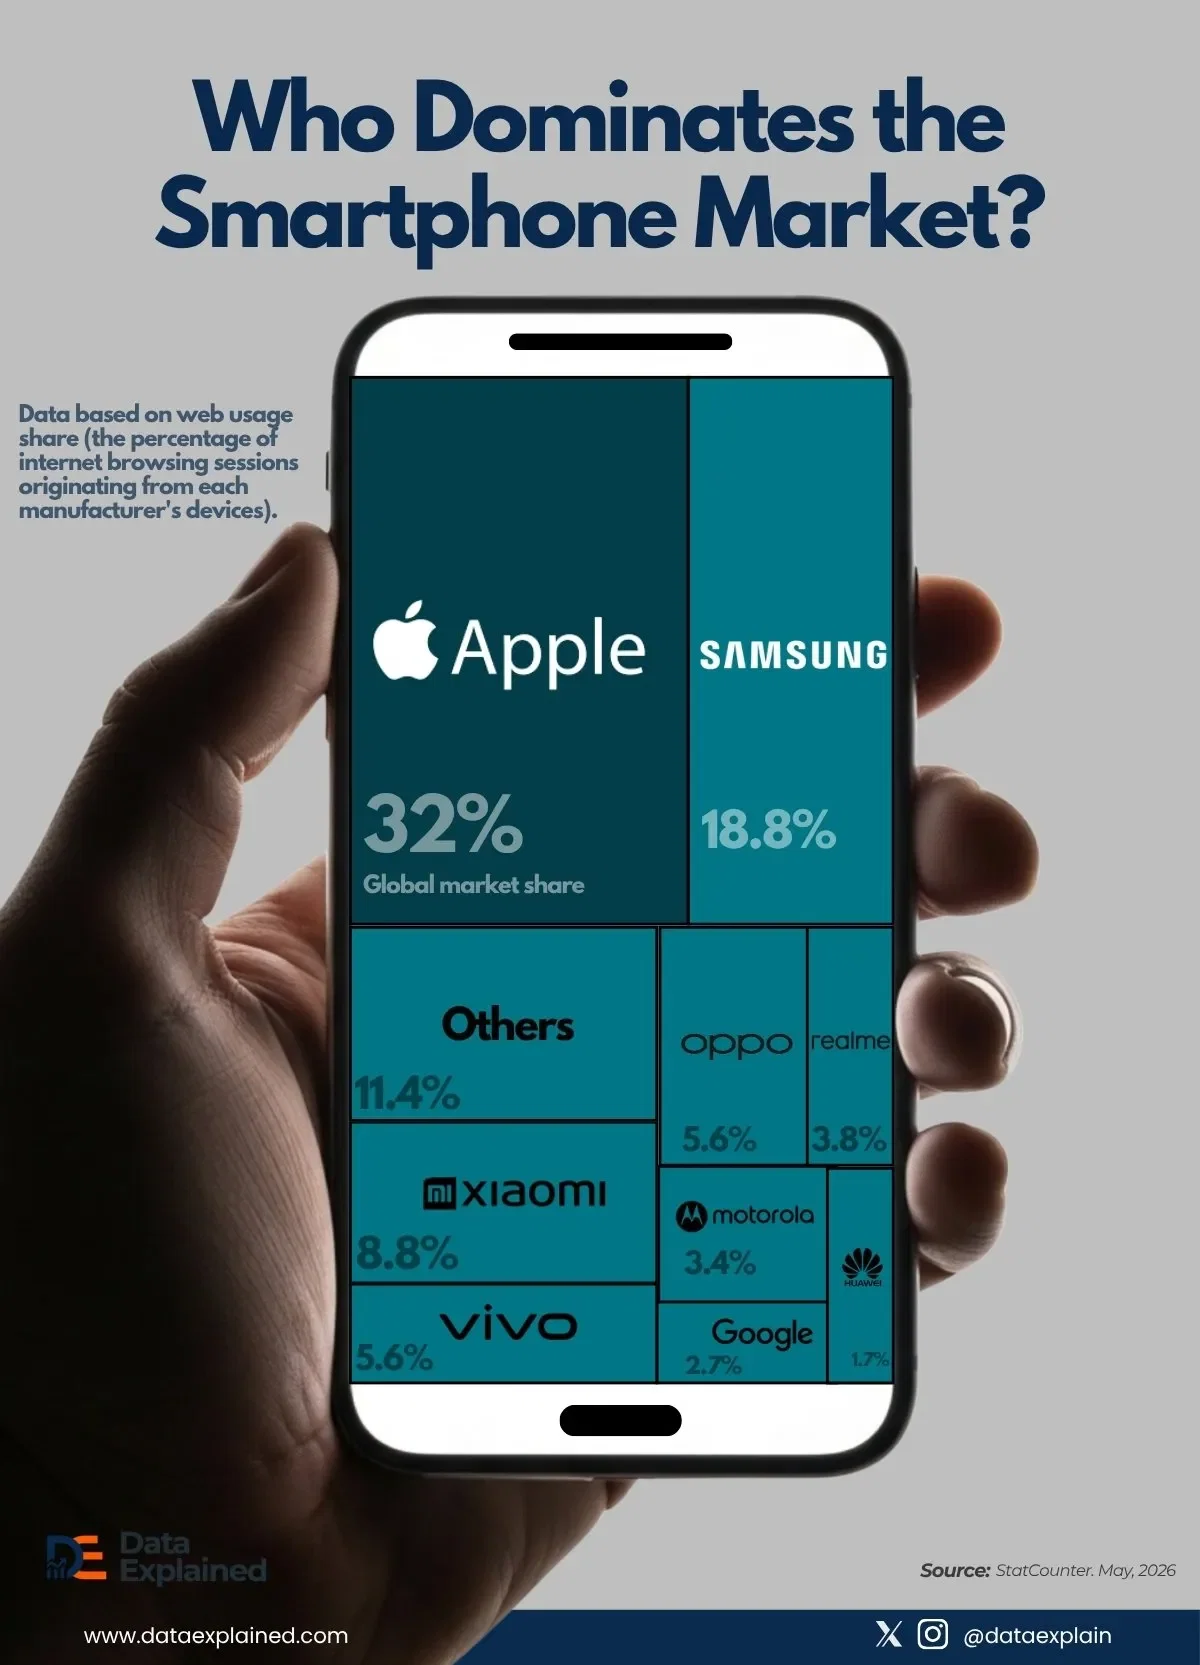
StatCounter’s global smartphone market share data for May 2026 ranks nine brands by web usage share (the percentage of internet browsing sessions originating from each manufacturer’s devices).
The result is a specific and revealing snapshot of who controls the world’s most personal computing device in 2026.
Before reading the numbers, the methodology matters.
StatCounter measures web traffic, not unit sales.
iPhone users browse the internet more intensively than the average Android user, generating more browser sessions per device.
Apple’s 31.95% in this dataset reflects usage intensity and premium-user behavior as much as it does market share.
In unit sales terms, Apple’s global share is closer to 18-20%.
Apple sits at 31.95%, nearly double Samsung’s 18.84%, its nearest named competitor.
The gap between first and second place is larger than Samsung’s entire share. It is larger than all five Chinese brands combined. It is larger than every other named entry in the table.
The gap exists for structural reasons.
Apple controls both its hardware and its iOS software, creating a closed ecosystem that produces extraordinary user retention. iPhone users browse more, spend more time in apps, and generate more traceable browser activity than Android users do globally.
Apple’s premium pricing restricts its devices to higher-income users who are also heavier internet consumers.
The combination of ecosystem lock-in and demographic concentration produces a web usage share that consistently overstates Apple’s unit volume advantage while accurately reflecting its dominance in the world’s most valuable consumer technology segment.