Where Data Tells the Story
© Voronoi 2025. All rights reserved.

In 2023, 40 percent of the 1.2 billion smartphones shipped worldwide were produced by either Apple or Samsung, according to IDC data, with the former carving out a lead of 8 million devices over the latter. This marks the first time the U.S. company overtook the South Korean electronics manufacturer in the mobile phone segment. Despite increasingly steep price tags for its newest phones, Apple's popularity is especially pronounced among younger U.S. residents.
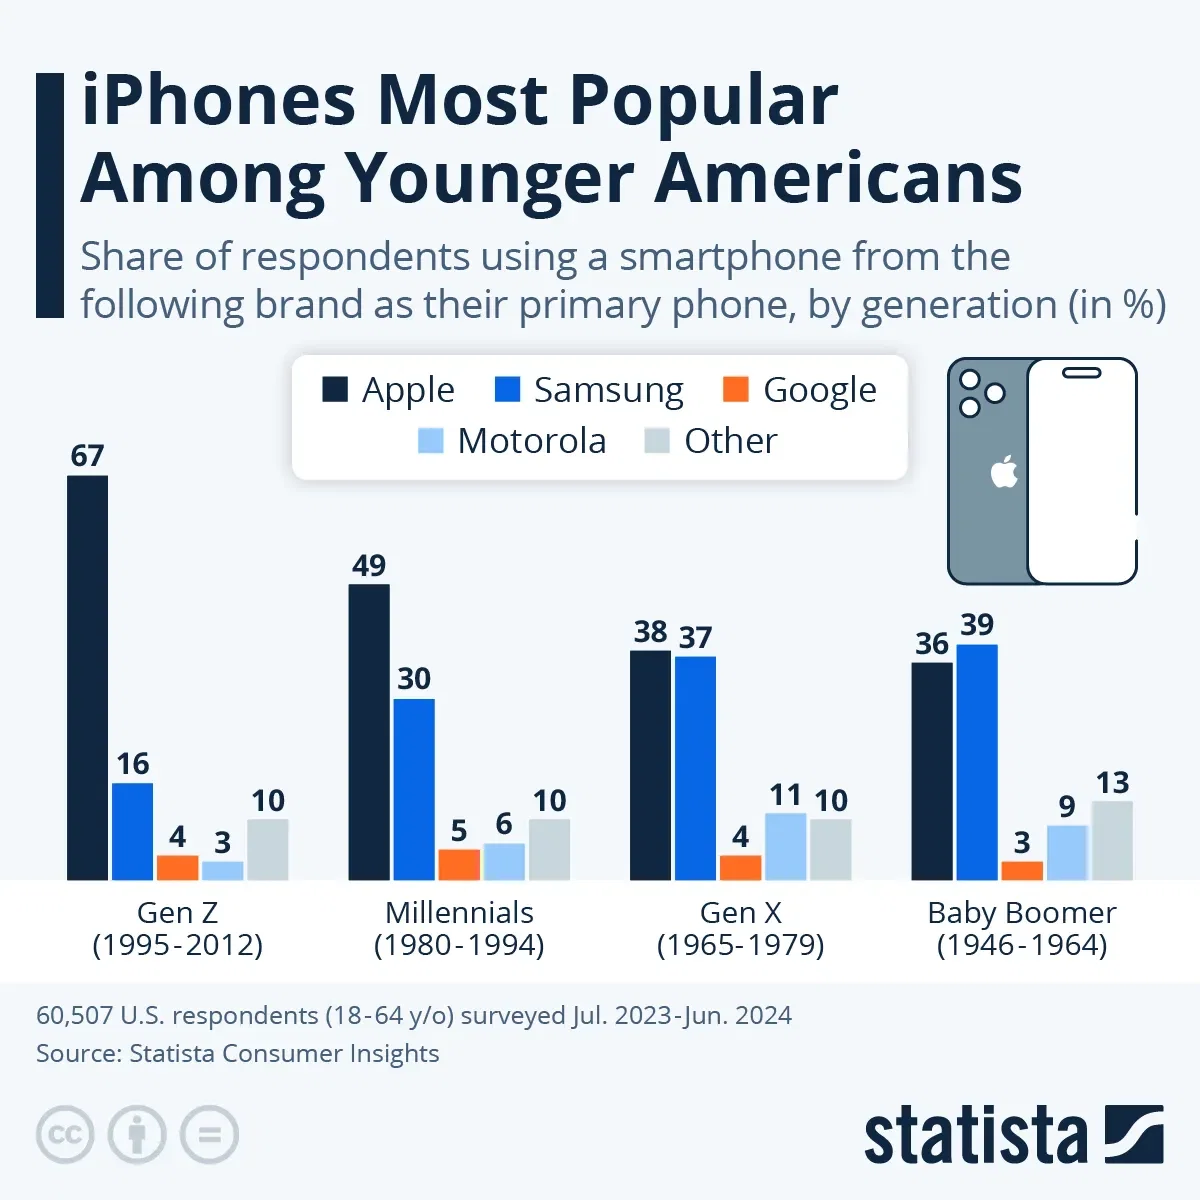
A recent Statista Consumer Insights survey shows that 67 percent of participants born between 1995 and 2016 use an iPhone as their primary smartphone, while 16 percent were Samsung users. This usage share drops significantly in the following generational brackets, with the South Korean company's products rapidly gaining popularity. For example, among all millennials surveyed, around half use an iPhone and 30 percent have a phone made by Samsung.
Looking at respondents born before 1979, the playing field between Apple and Samsung is even more level. Both brands exhibit a share of between 36 and 39 percent in both the Gen Xers and Baby Boomers. Interestingly, Motorola is also popular among members of these two generations. Google, which just unveiled its new Pixel 9, Pixel 9 Pro, Pixel 9 Pro XL and Pixel 9 Fold smartphones at its annual Made by Google event, remains a niche player across all generations.