
Where Data Tells the Story
© Voronoi 2026. All rights reserved.

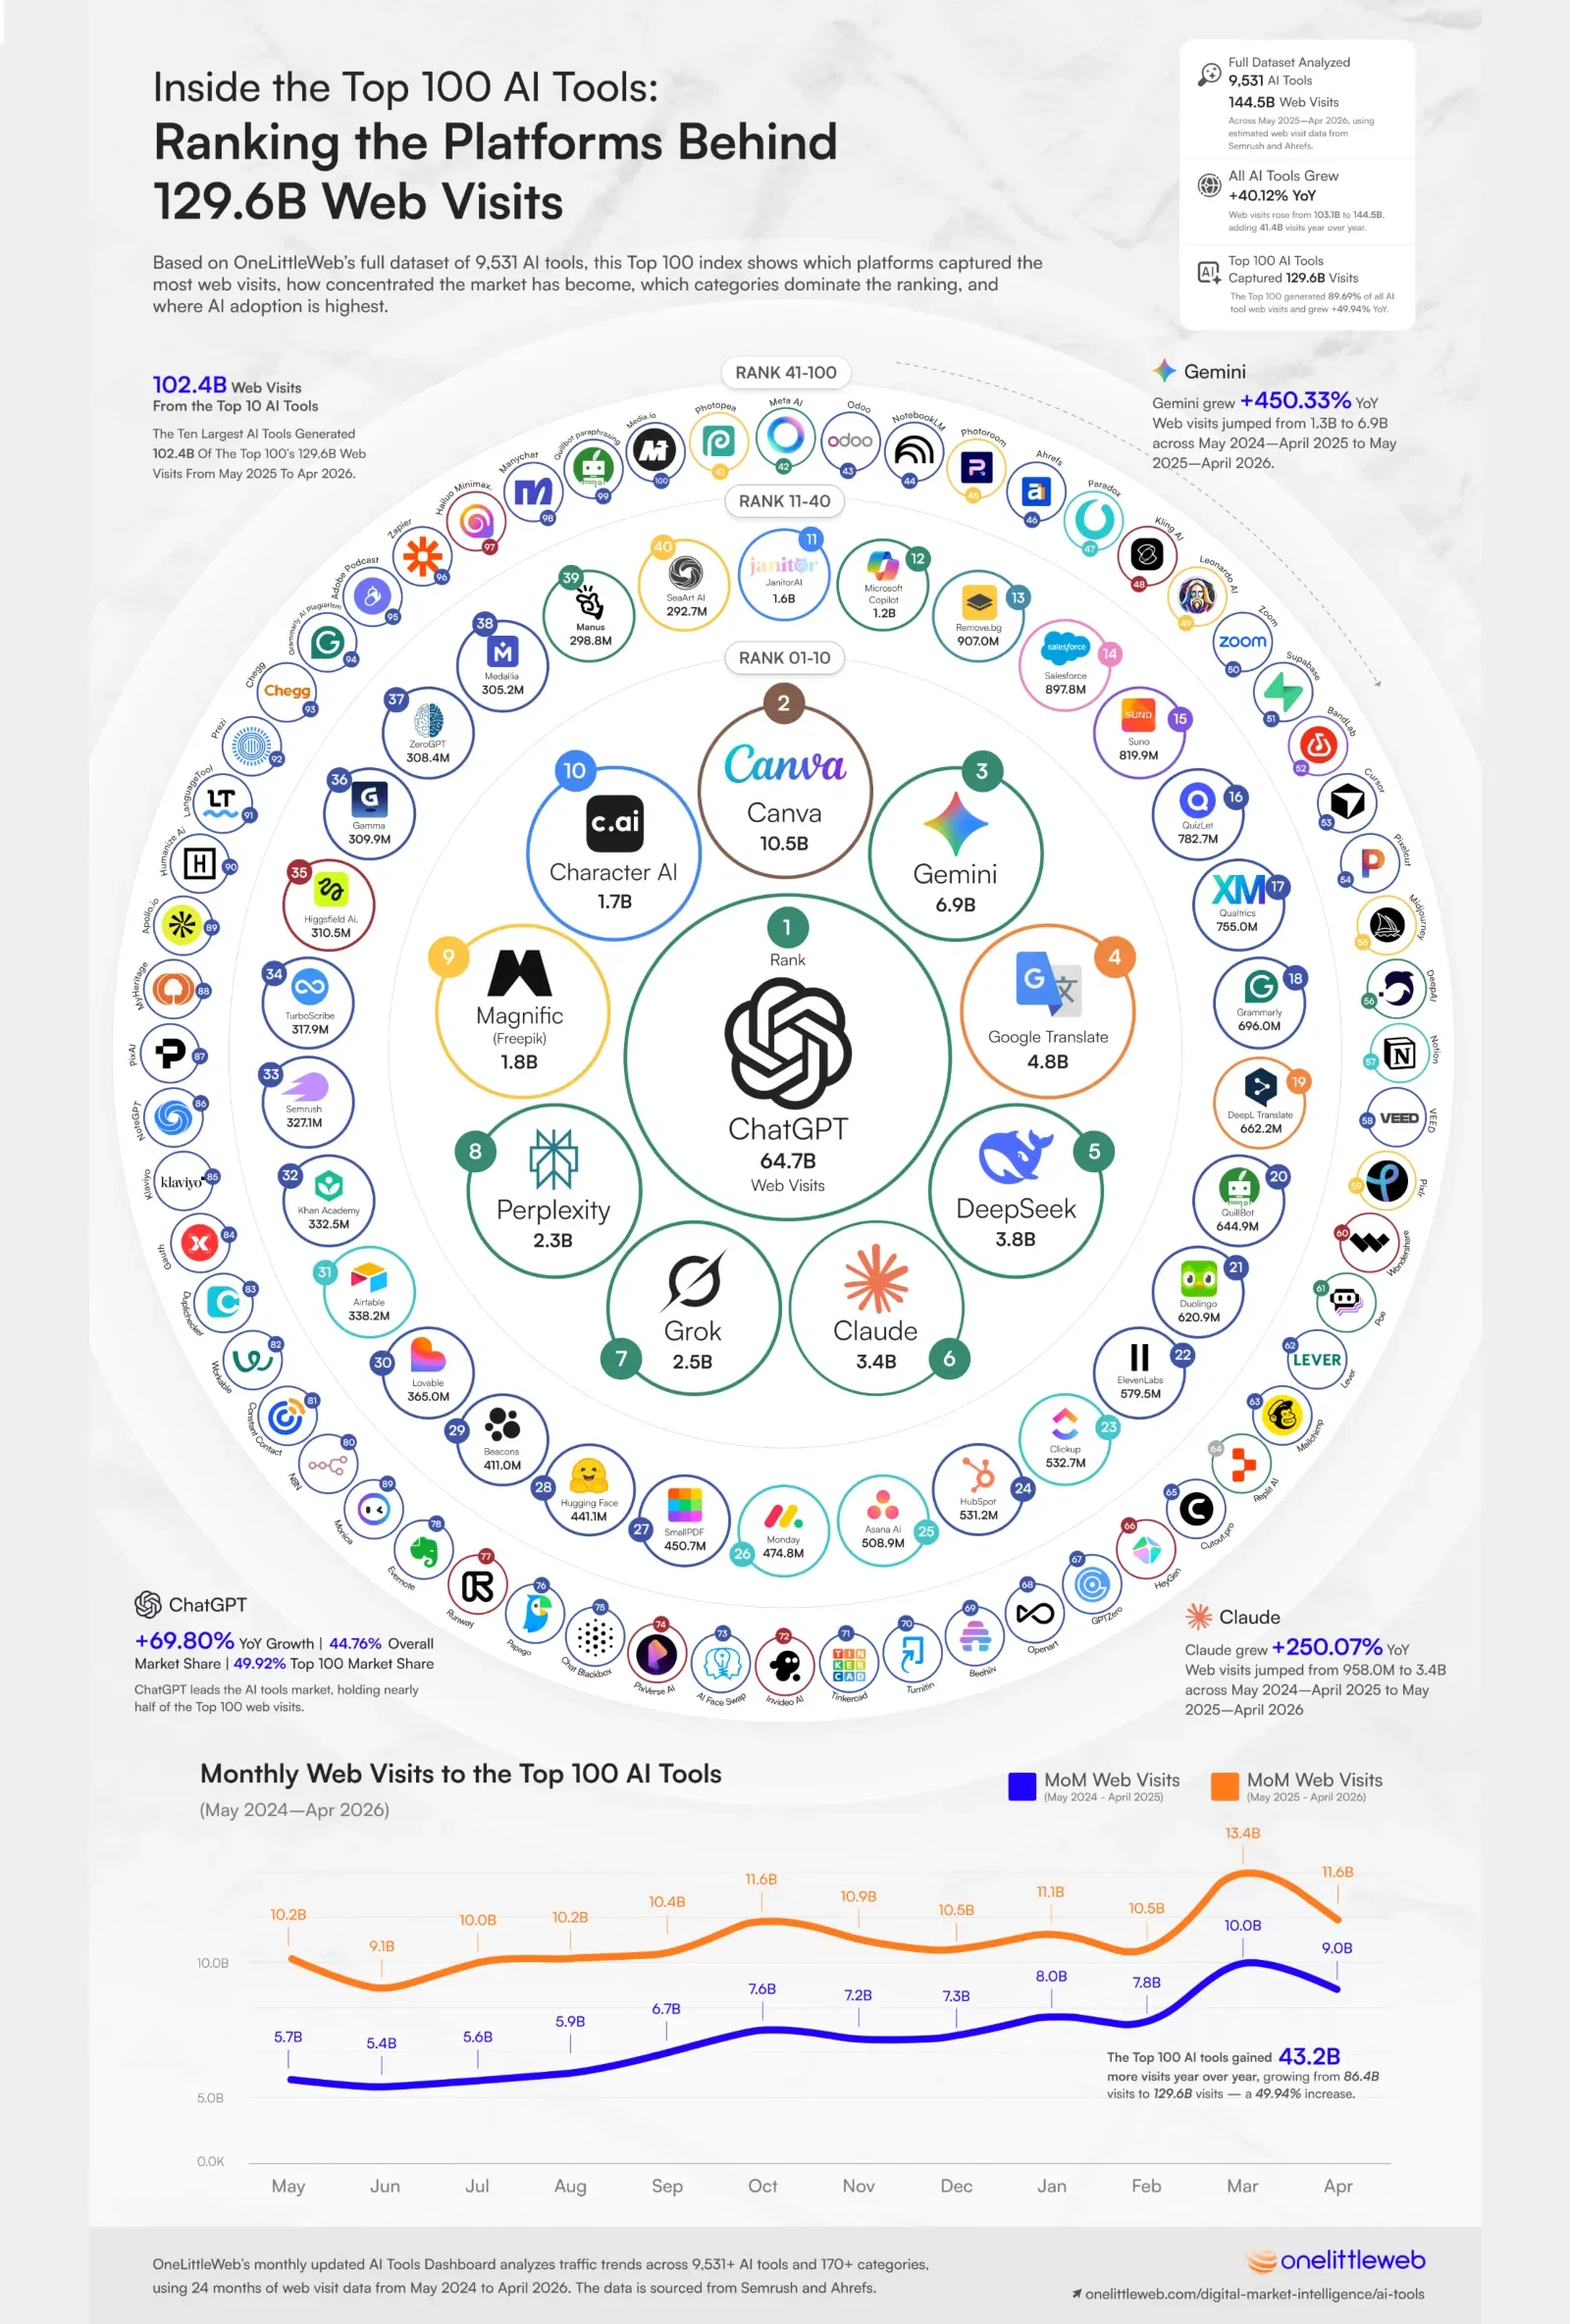
The AI tools market has grown from a relatively new part of the internet into a major source of global web activity.
Between May 2025 and April 2026, the 9,531 AI tools included in our study generated 144.5 billion web visits, an increase of 40.12% year over year.
To put that scale into perspective, we compared the AI tools market with a wider dataset of 10,173 major websites in the world that generated 3.44 trillion visits over the same period. AI tools accounted for 4.20% of all tracked web visits.
That may still look like a relatively small share of the wider web, but the speed of growth tells a more important story. AI tools have reached this point within only a few years, and usage remains heavily concentrated around the market’s largest products.
From the full AI market of 9,531 tools, we then narrowed our analysis to the 100 most-visited AI tools.
Together, the Top 100 generated 129.6 billion web visits, representing 89.69% of all AI tool visits recorded during the latest 12-month period.
They also grew 49.94% year over year, significantly faster than the 40.12% growth recorded across the wider AI tools market.
In other words, nearly nine out of every ten AI tool visits went to just 100 AI tools, while the remaining 9,431 tools competed for only a small fraction of the market.
This master infographic ranks those top 100 AI tools by total web visits from May 2025 to April 2026. It also shows their categories, year-over-year growth, and web visit trends of the last 24 months (May 2024 - April 2026).
AI Traffic Hit 144.5 Billion Visits, but Nearly 90% Went to Just 100 Tools:
The 9,531 AI tools in our study generated 144.5 billion web visits over the past 12 months, up 40.12% year over year. The Top 100 AI tools alone accounted for 129.6 billion visits, grew 49.94%, and held an 89.69% market share of all AI tool web visits we tracked—meaning nearly 9 out of every 10 visits went to just 100 platforms.
AI Feels Everywhere, Yet It Holds Just 4.20% of Tracked Web Traffic:
The 10,173 websites in OneLittleWeb’s Most Popular Websites dashboard generated 3.44 trillion visits during the same period. AI tools contributed 144.5 billion visits, giving them a 4.20% market share of all tracked web visits. AI has already become a major technology market, but compared with the wider web, it still has considerable room to grow.
ChatGPT Is in a League of Its Own:
ChatGPT generated 64.7 billion web visits, representing 44.76% of the entire AI tools market and 49.92% of traffic within the top 100. Canva ranked second with 10.5 billion visits, leaving ChatGPT with more than six times the traffic of its closest competitor in the overall ranking.
The Challengers Are Growing Fast, but ChatGPT Still Sets the Pace:
ChatGPT added 26.6 billion web visits, more than any other tool, as its traffic increased 69.80% year over year. Gemini recorded the second-largest gain, adding 5.6 billion visits and growing 450.33%, while Claude added 2.4 billion visits, up 250.07%, and Grok grew 731.26% to reach 2.5 billion visits.
Study, Writing, and Translation Tools Are Losing Ground:
Google Translate lost 1.5 billion visits, down 23.46%, marking the largest absolute decline among all tools in the ranking. Chegg declined 61.45%, Quizlet fell 29.09%, and QuillBot lost 25.24%, suggesting that some users may be shifting from specialized learning and writing platforms toward broader AI assistants.
Chatbots Now Control More Than Half of the AI Market:
The chatbot category grew from 45.1 billion to 86.0 billion visits, an increase of 90.82%, and reached a 59.49% market share. Translators moved in the opposite direction, losing 1.6 billion visits, or 22.52%, as user attention continued to concentrate around general-purpose conversational platforms.
Singapore Uses AI Most Intensely, While the U.S. Leads in Total Traffic:
Singapore ranked first with 16.1 million AI web visits per 100,000 people, despite having a population of only 5.9 million. The Netherlands followed with 9.8 million visits per 100,000 people, ahead of the United States at 8.4 million, while the U.S. still generated the highest overall volume at 29.2 billion visits.
We analyzed 9,531 AI tools across 170+ categories using the OneLittleWeb AI Tools Dashboard. Monthly web visit estimates from Semrush and Ahrefs were consolidated from May 2024 to April 2026.
The Top 100 ranking is based on total web visits from May 2025 to April 2026, compared with the previous 12 months to calculate year-over-year growth. Market share was measured against the 144.5 billion visits generated by all tools in the study.
The data covers public website visits and does not fully capture usage through apps, APIs, desktop software, private workspaces, or third-party integrations.
Explore the complete Top 100 ranking, category analysis, 24-month trends, market winners and losers, and global AI adoption data.