
Where Data Tells the Story
© Voronoi 2026. All rights reserved.

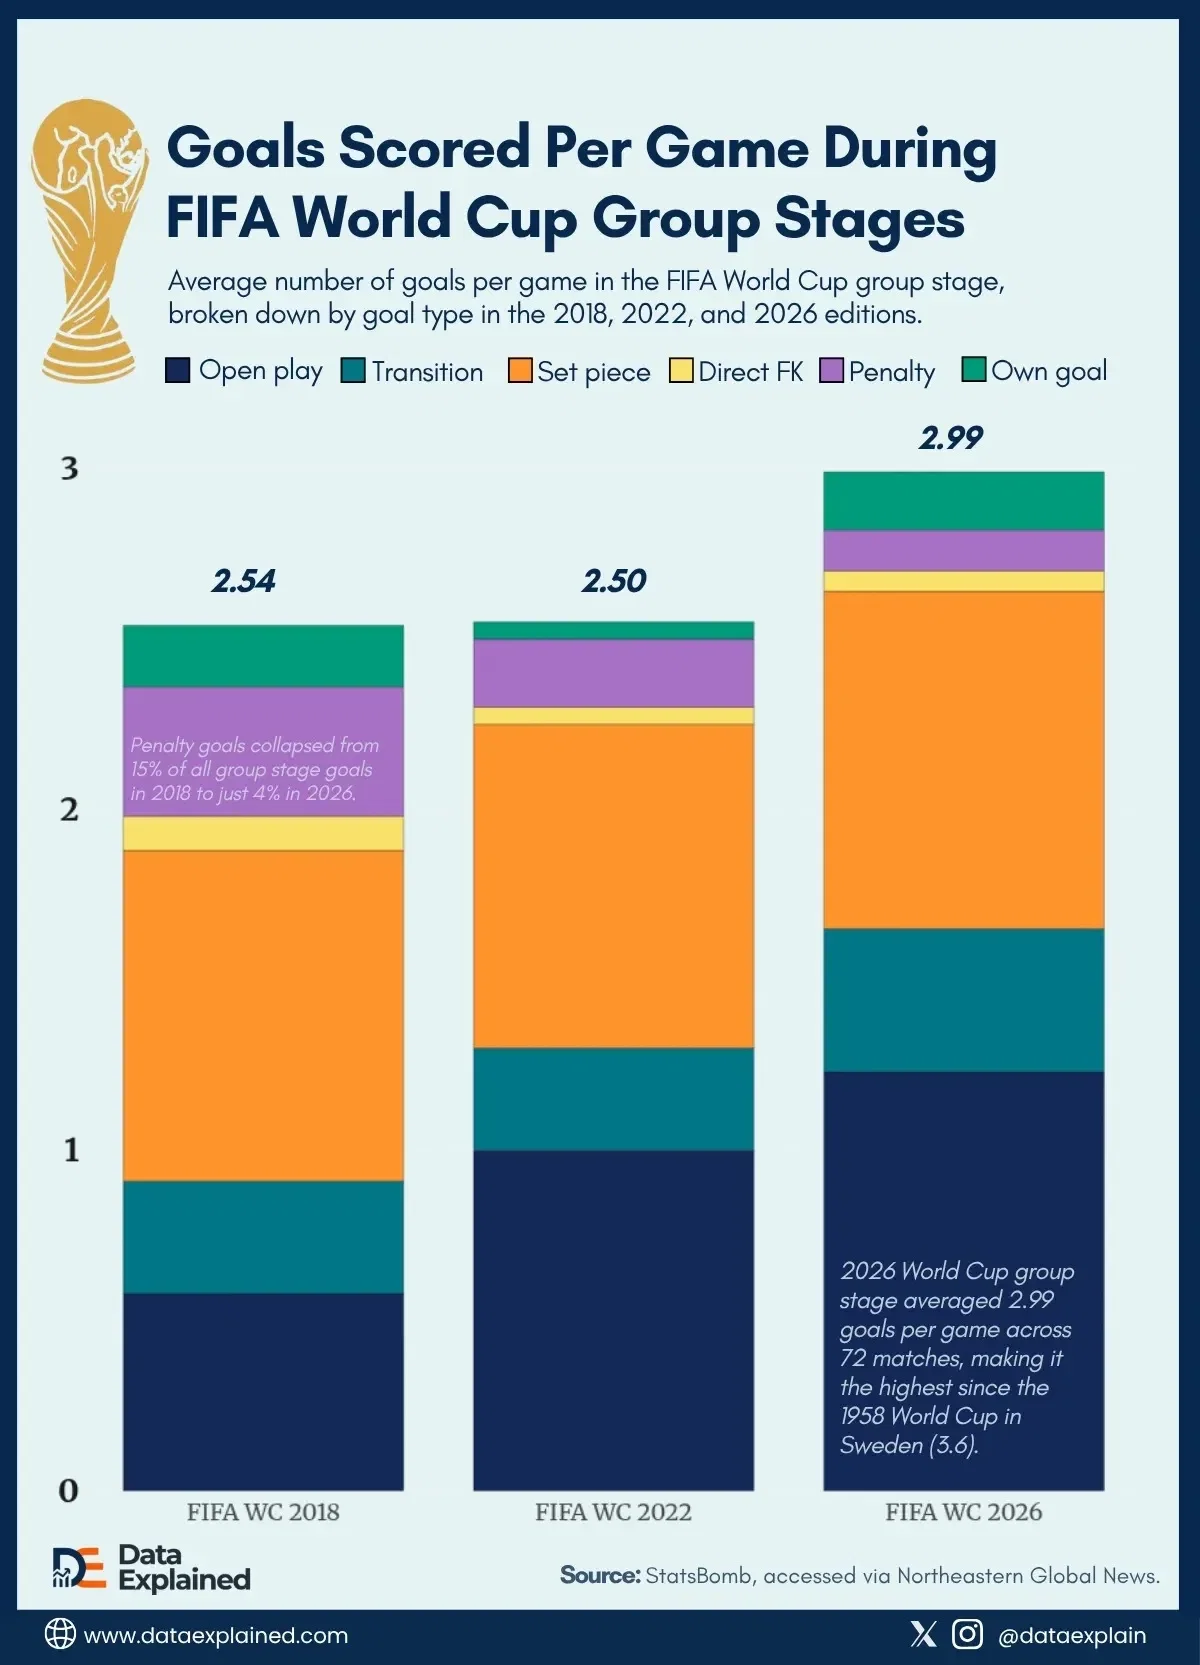
The 2026 FIFA World Cup group stage, which kicked off on June 11 in Mexico City and concluded on June 28, produced the highest average goals per game of any World Cup group stage since Sweden hosted the tournament in 1958
Using StatsBomb data, the infographic above shows the average number of goals per game in the FIFA World Cup group stage.
It is broken down by goal type and compares the 2018, 2022, and 2026 editions.
ALSO READ: FIFA Says World Cup Will Add $17B to US Economy; Here’s Where The Money Goes
The inverse of the open play story is the penalty story, and it is striking.
In 2018 (the first World Cup to use VAR), penalties accounted for 15% of all goals, the highest proportion of any category that year, at 0.38 goals on average per game.
The introduction of video review technology produced a calibration effect.
Fouls and handball incidents previously missed by referees were suddenly being reviewed and awarded.
That is a 68.5% reduction in penalty scoring since 2018.
The 2026 figure may represent the floor of what penalty scoring looks like once VAR is fully embedded into tournament behavior.
ALSO READ: Visualized: Every Country That Has Ever Hosted the World Cup