
Where Data Tells the Story
© Voronoi 2026. All rights reserved.

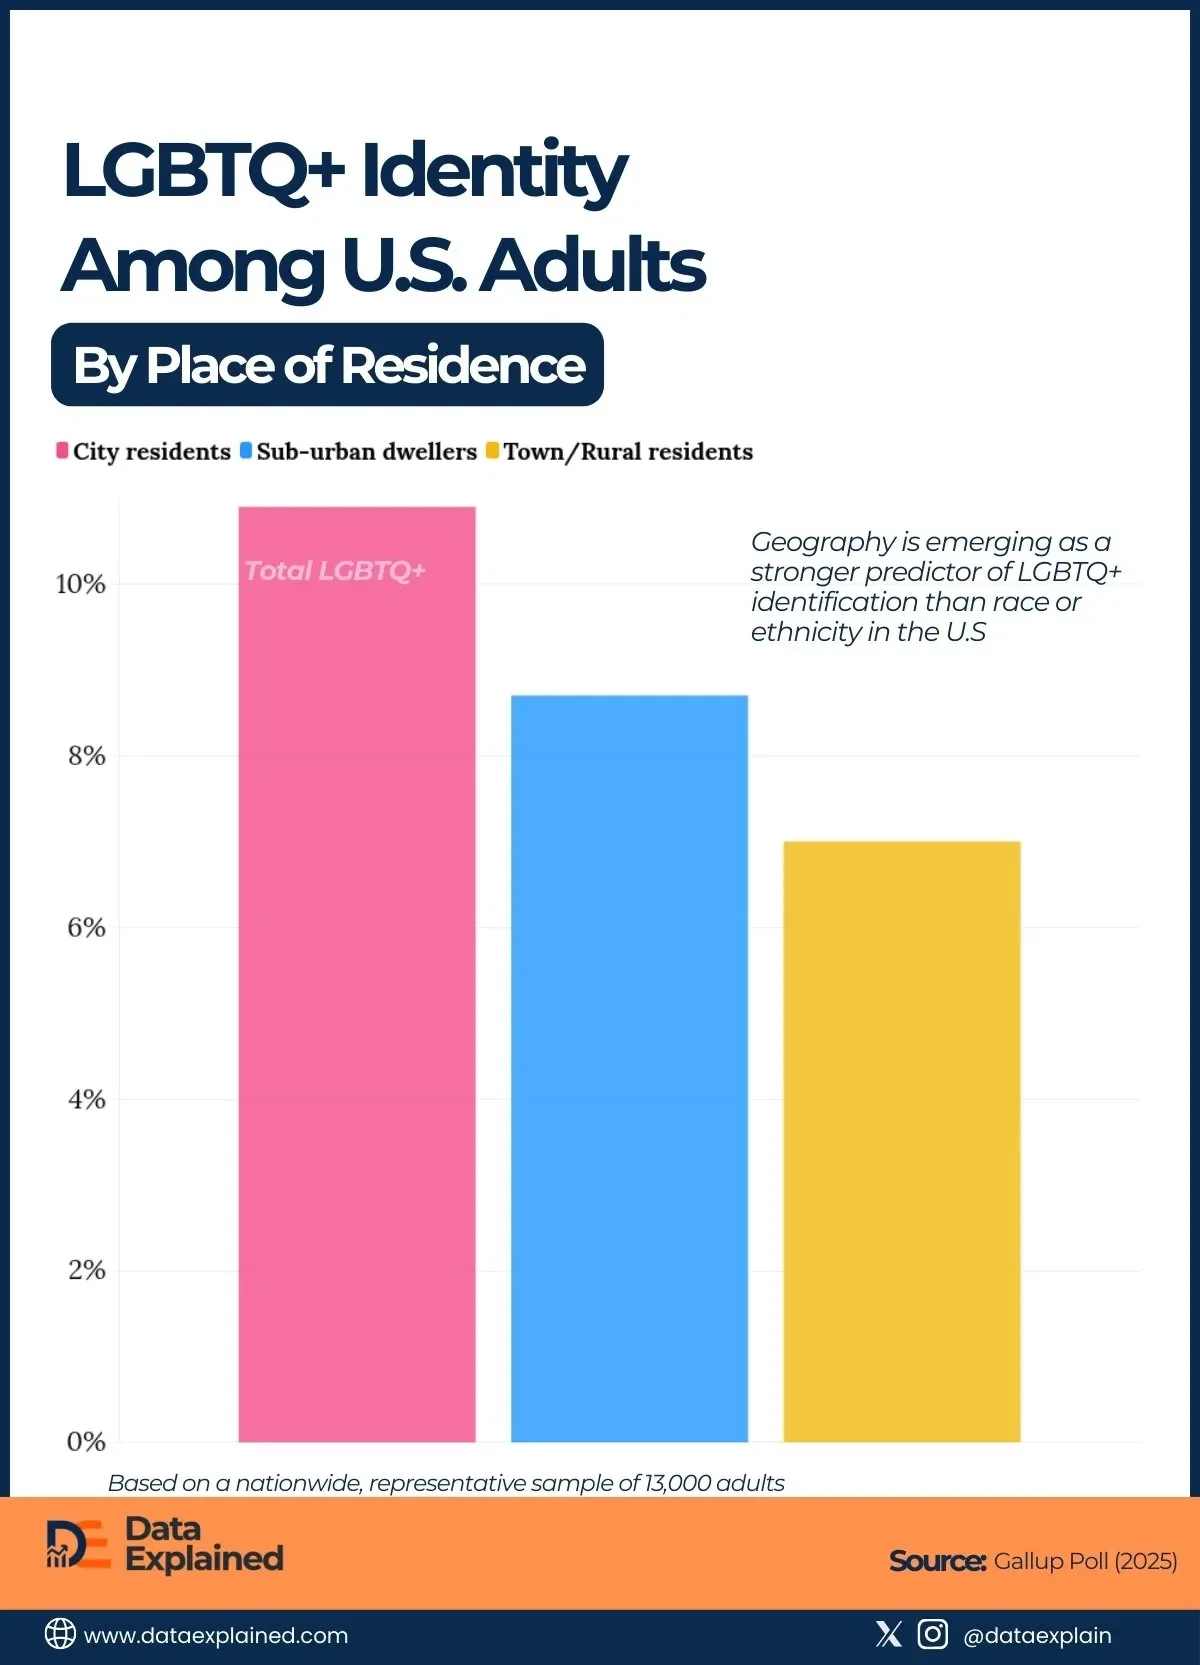
It may surprise you to know that city residents are more likely than those living in suburban or rural areas to identify as LGBTQ+. This data comes from a 2025 Gallup survey of 13,000 US adults.
In the graphics above, we visualized LGBTQ+ Identity Among U.S. Adults, by Subgroup as of the end of 2025. As you see, nearly 11% of respondents who identify as LGBTQ+ are city residents, higher than in other areas.