Real EstateApr 6, 2024
Average Annual Homeowners Insurance Rates
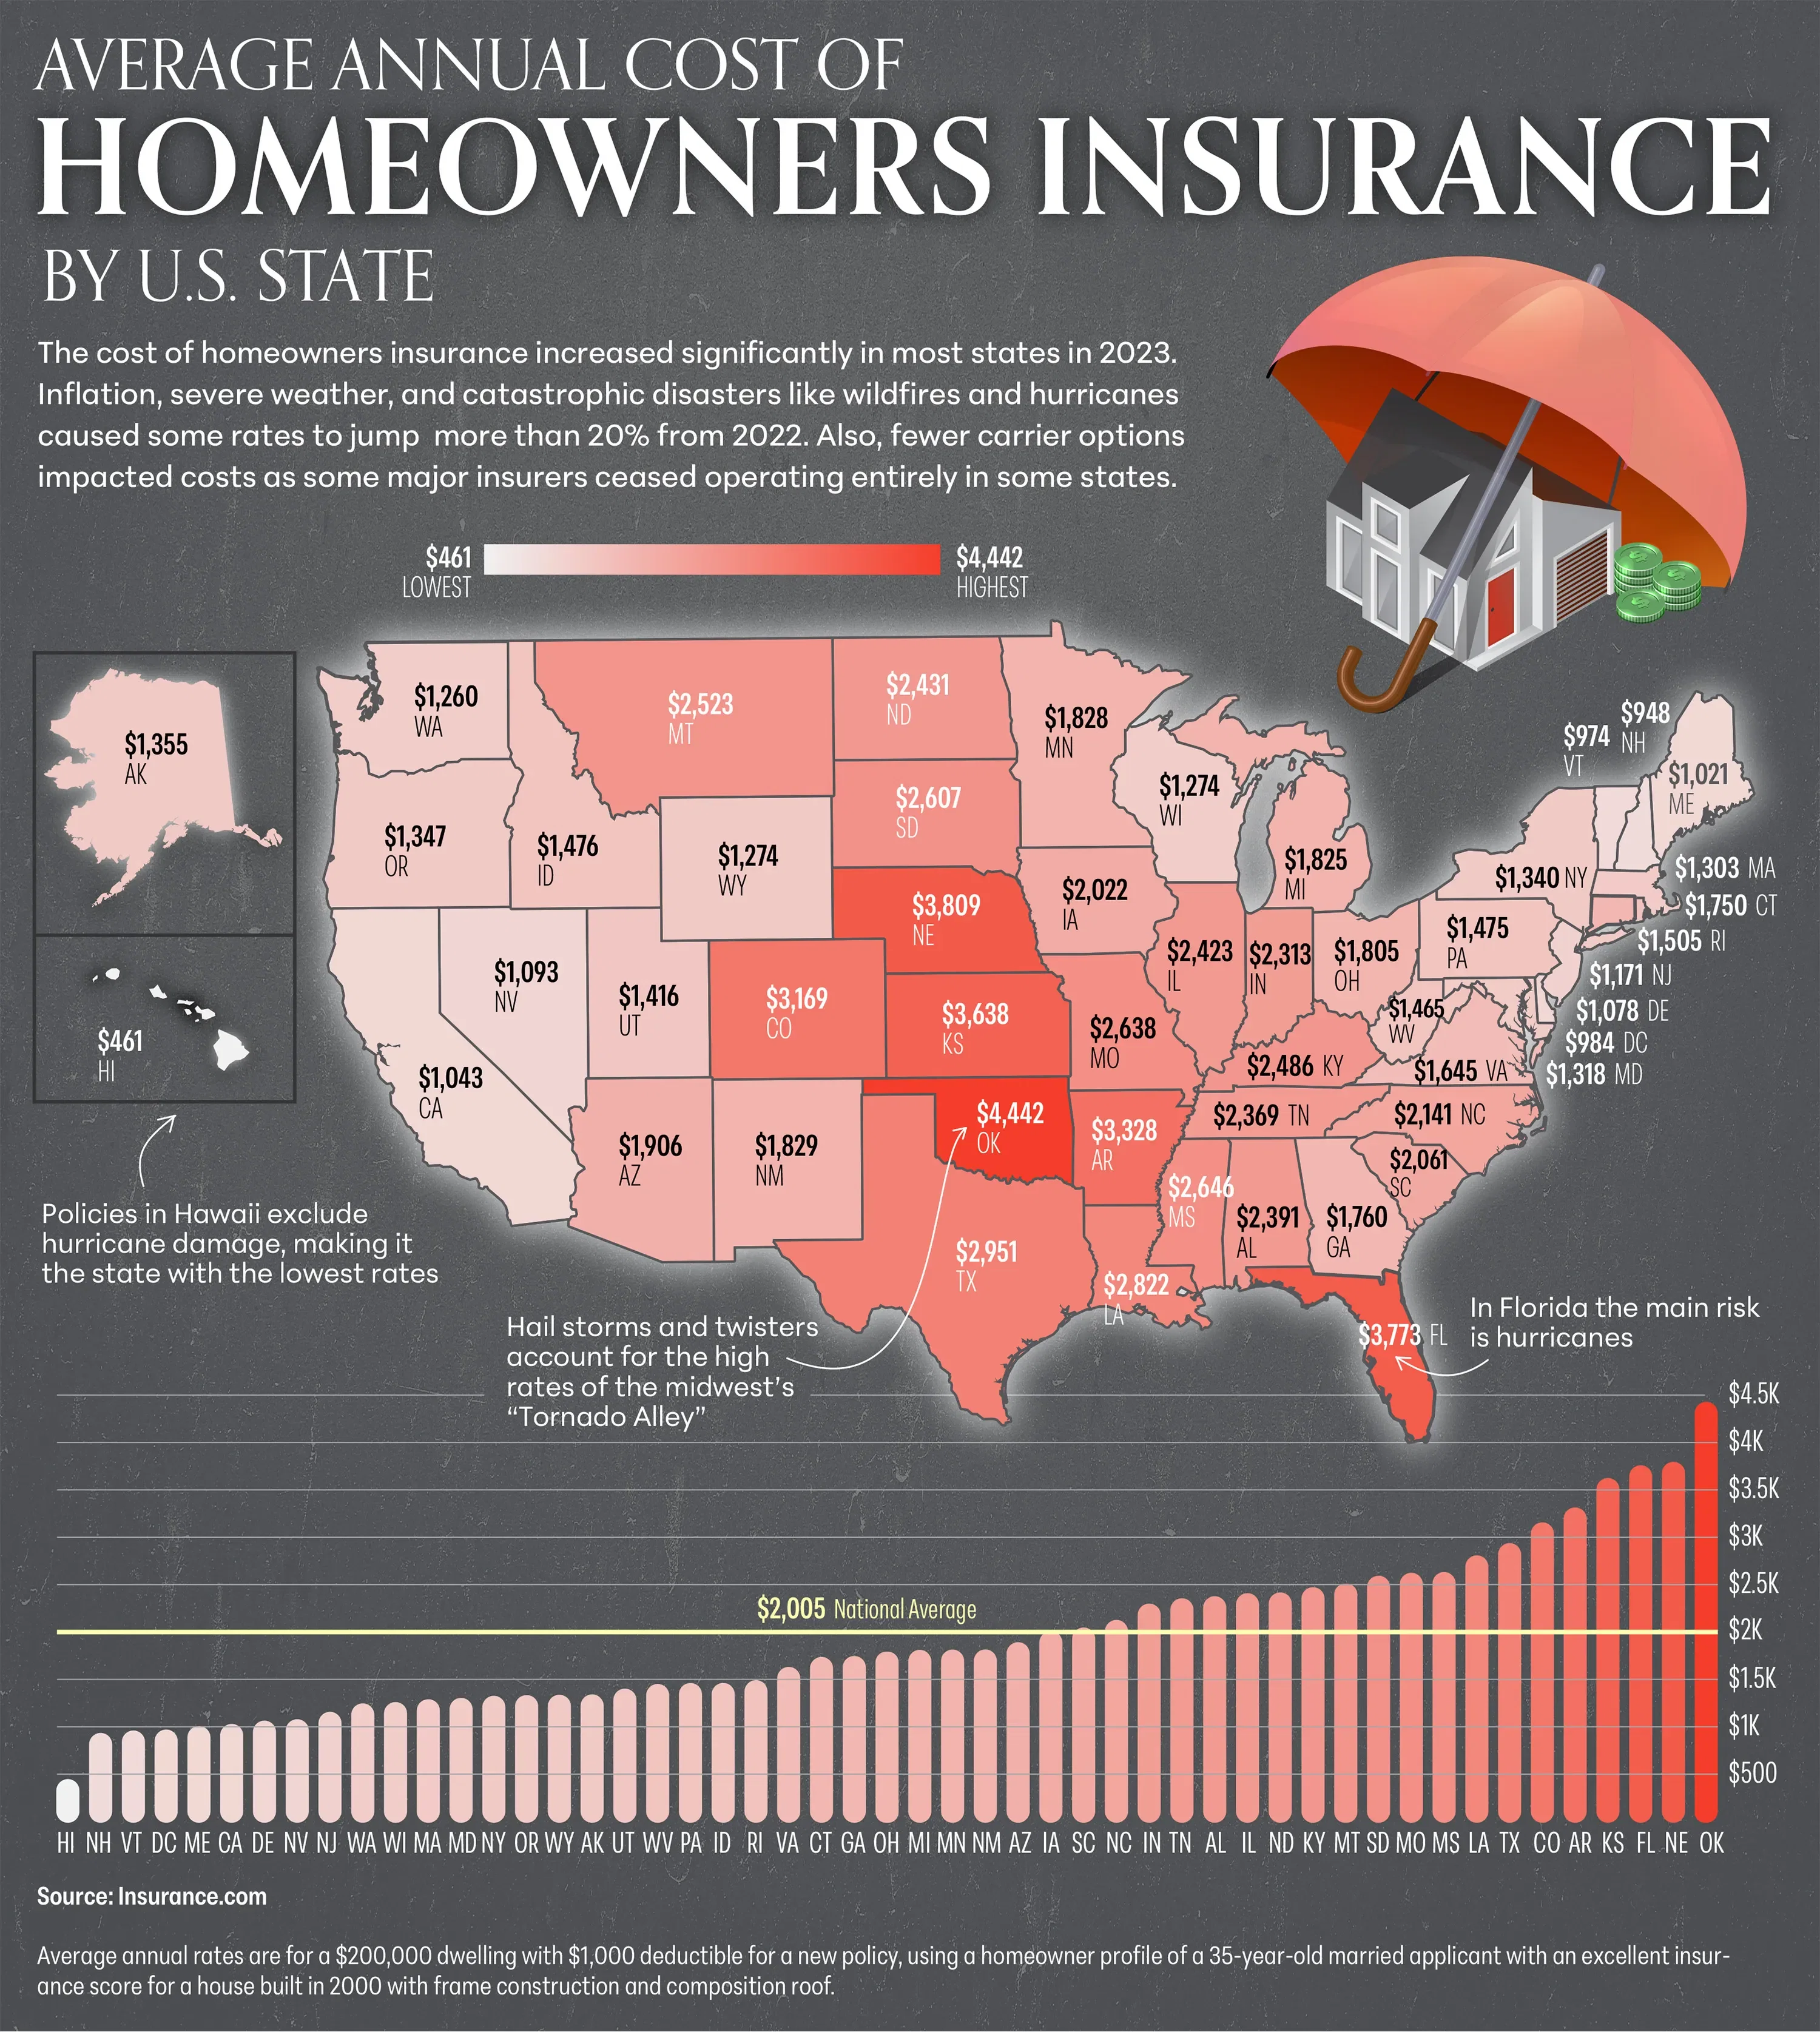
Homeowners insurance increased significantly in 2023 for most states. Causes include inflation, severe weather and catastrophic national disasters like wildfires and hurricanes. Compounding the problem is a lack of options for homeowners as many major insurance providers withdrew completely in some states.
The states with the highest rates are located in the “Tornado Alley” region of the midwest, prone to severe weather like hail storms and twisters. Homeowner policies in Hawaii are lowest due to the lack of hurricane coverage there. Florida, on the other hand, is also subject to hurricanes, causing its rate to be one of the highest.
This data is the average annual rate for a $200,000 dwelling in each state.
Dataset
State | Average Homeowners Insurance Rate (yearly) | |
---|---|---|
Alabama | 2,391 | |
Alaska | 1,355 | |
Arizona | 1,906 | |
Arkansas | 3,328 | |
California | 1,043 | |
Colorado | 3,169 | |
Connecticut | 1,750 | |
Delaware | 1,078 | |
Florida | 3,773 | |
Georgia | 1,760 | |
Hawaii | 461 | |
Idaho | 1,476 | |
Illinois | 2,423 | |
Indiana | 2,313 | |
Iowa | 2,022 | |
Kansas | 3,638 | |
Kentucky | 2,486 | |
Louisiana | 2,822 | |
Maine | 1,021 | |
Maryland | 1,318 | |
Massachusetts | 1,303 | |
Michigan | 1,825 | |
Minnesota | 1,828 | |
Mississippi | 2,646 | |
Missouri | 2,638 | |
Montana | 2,523 | |
Nebraska | 3,809 | |
Nevada | 1,093 | |
New Hampshire | 948 | |
New Jersey | 1,171 | |
New Mexico | 1,829 | |
New York | 1,340 | |
North Carolina | 2,141 | |
North Dakota | 2,431 | |
Ohio | 1,805 | |
Oklahoma | 4,442 | |
Oregon | 1,347 | |
Pennsylvania | 1,475 | |
Rhode Island | 1,505 | |
South Carolina | 2,061 | |
South Dakota | 2,607 | |
Tennessee | 2,369 | |
Texas | 2,951 | |
Utah | 1,416 | |
Vermont | 974 | |
Virginia | 1,645 | |
Washington | 1,260 | |
Washington, D.C. | 984 | |
West Virginia | 1,465 | |
Wisconsin | 1,274 | |
Wyoming | 1,351 |
33
0
13.0K