Where Data Tells the Story
© Voronoi 2026. All rights reserved.
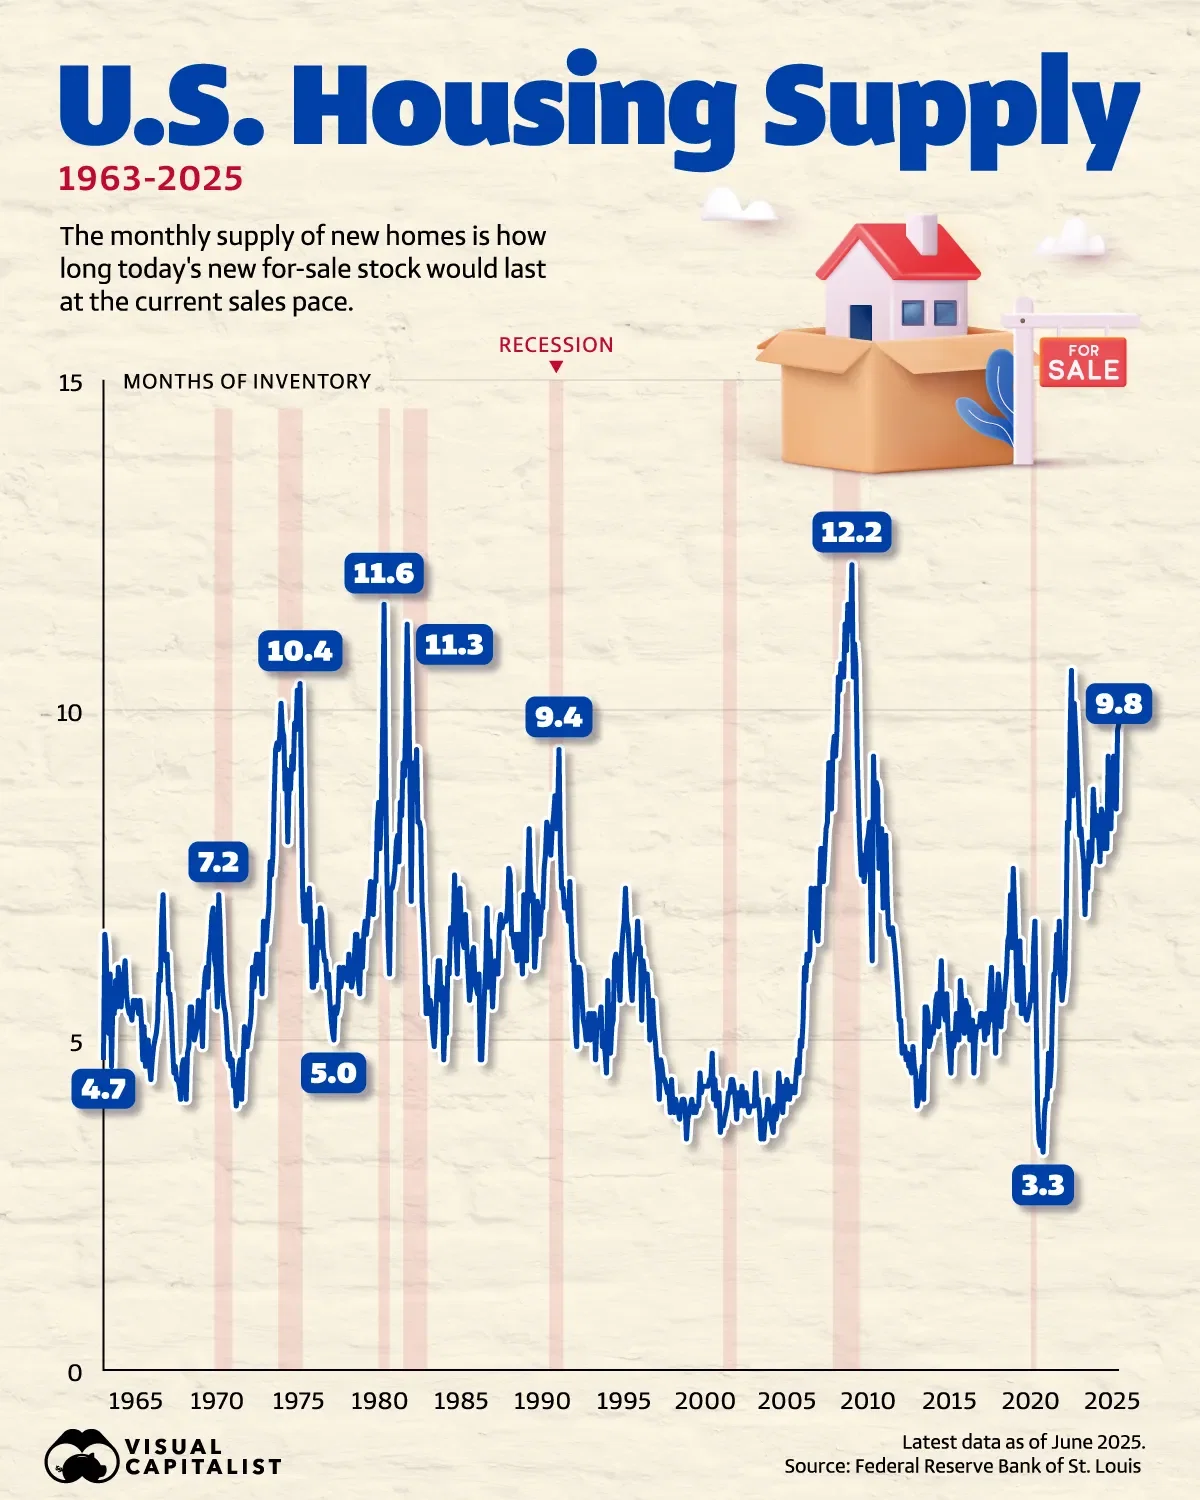
This chart tracks the monthly supply of new homes in the U.S. from 1963 through June 2025, expressed in months of inventory.
This indicates how many months today's new for-sale stock would last at the current sales pace without any new additions to the housing supply.
The data comes from the Federal Reserve Bank of St. Louis.