Where Data Tells the Story
© Voronoi 2025. All rights reserved.

Note: This graphic was updated on 2023-12-01. Median Household Income is now shown in nominal terms, rather than real USD.
What we’re showing
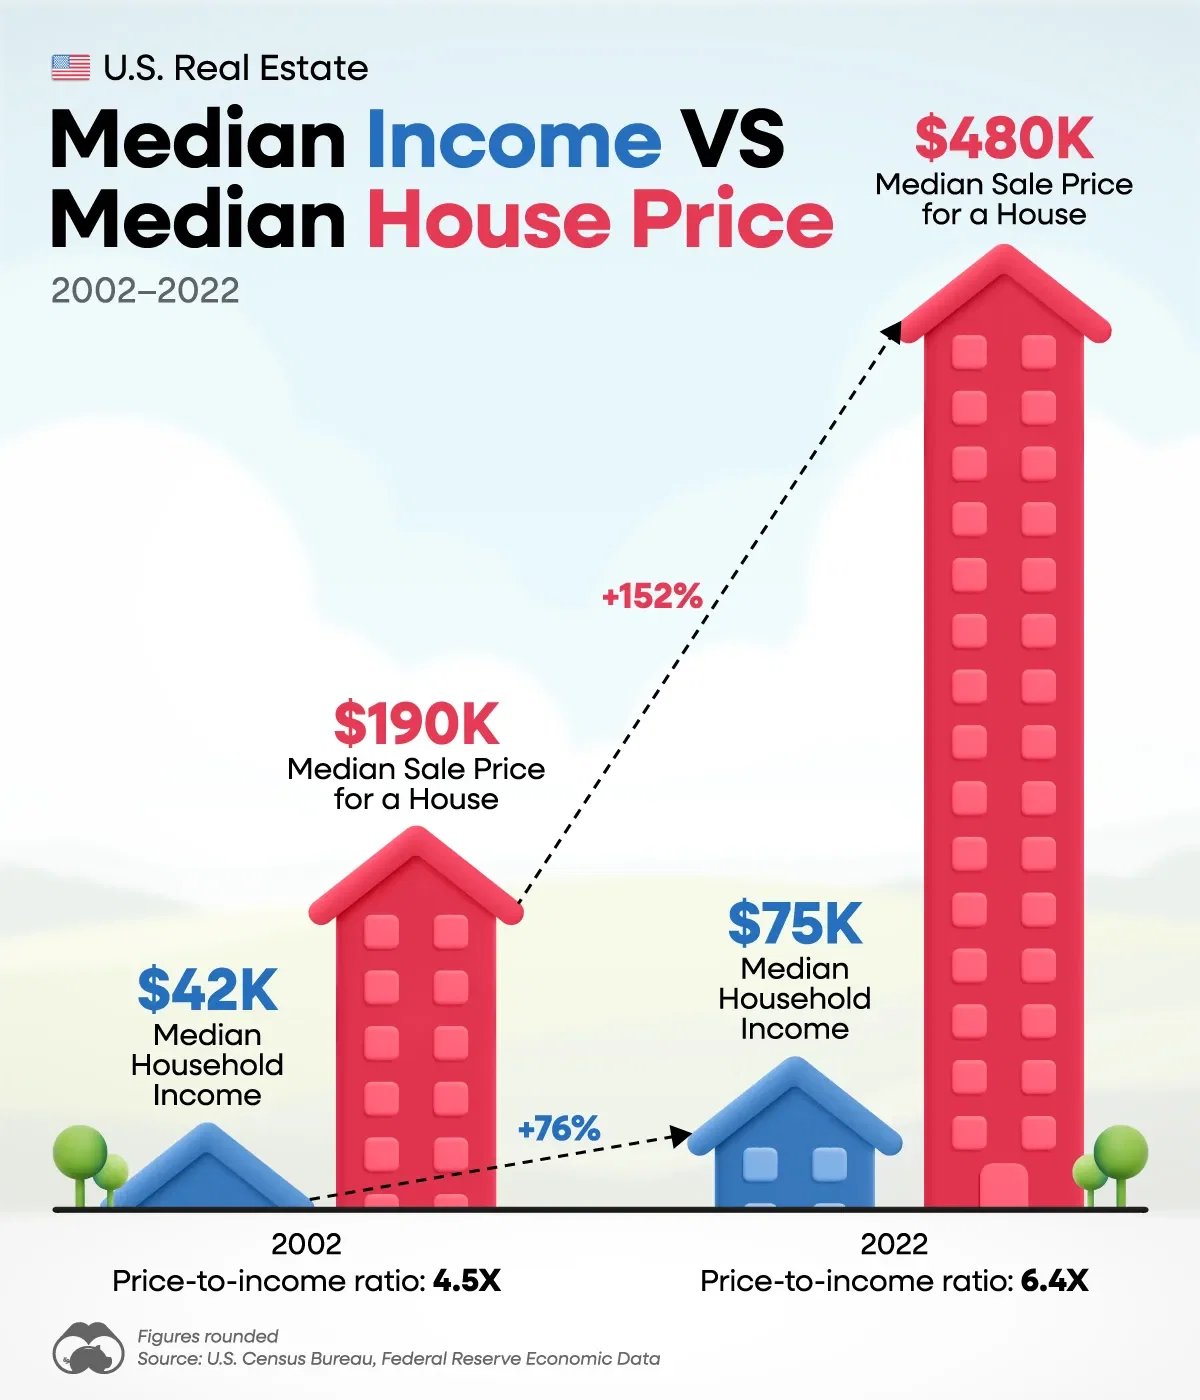
Median household income beside the median sale price for a house, for the years 2002 and 2022. All figures are in current dollars (not inflation adjusted).
Key takeaway
Over the past decade, growth in house prices has greatly outpaced income growth in the U.S.