
Where Data Tells the Story
© Voronoi 2026. All rights reserved.

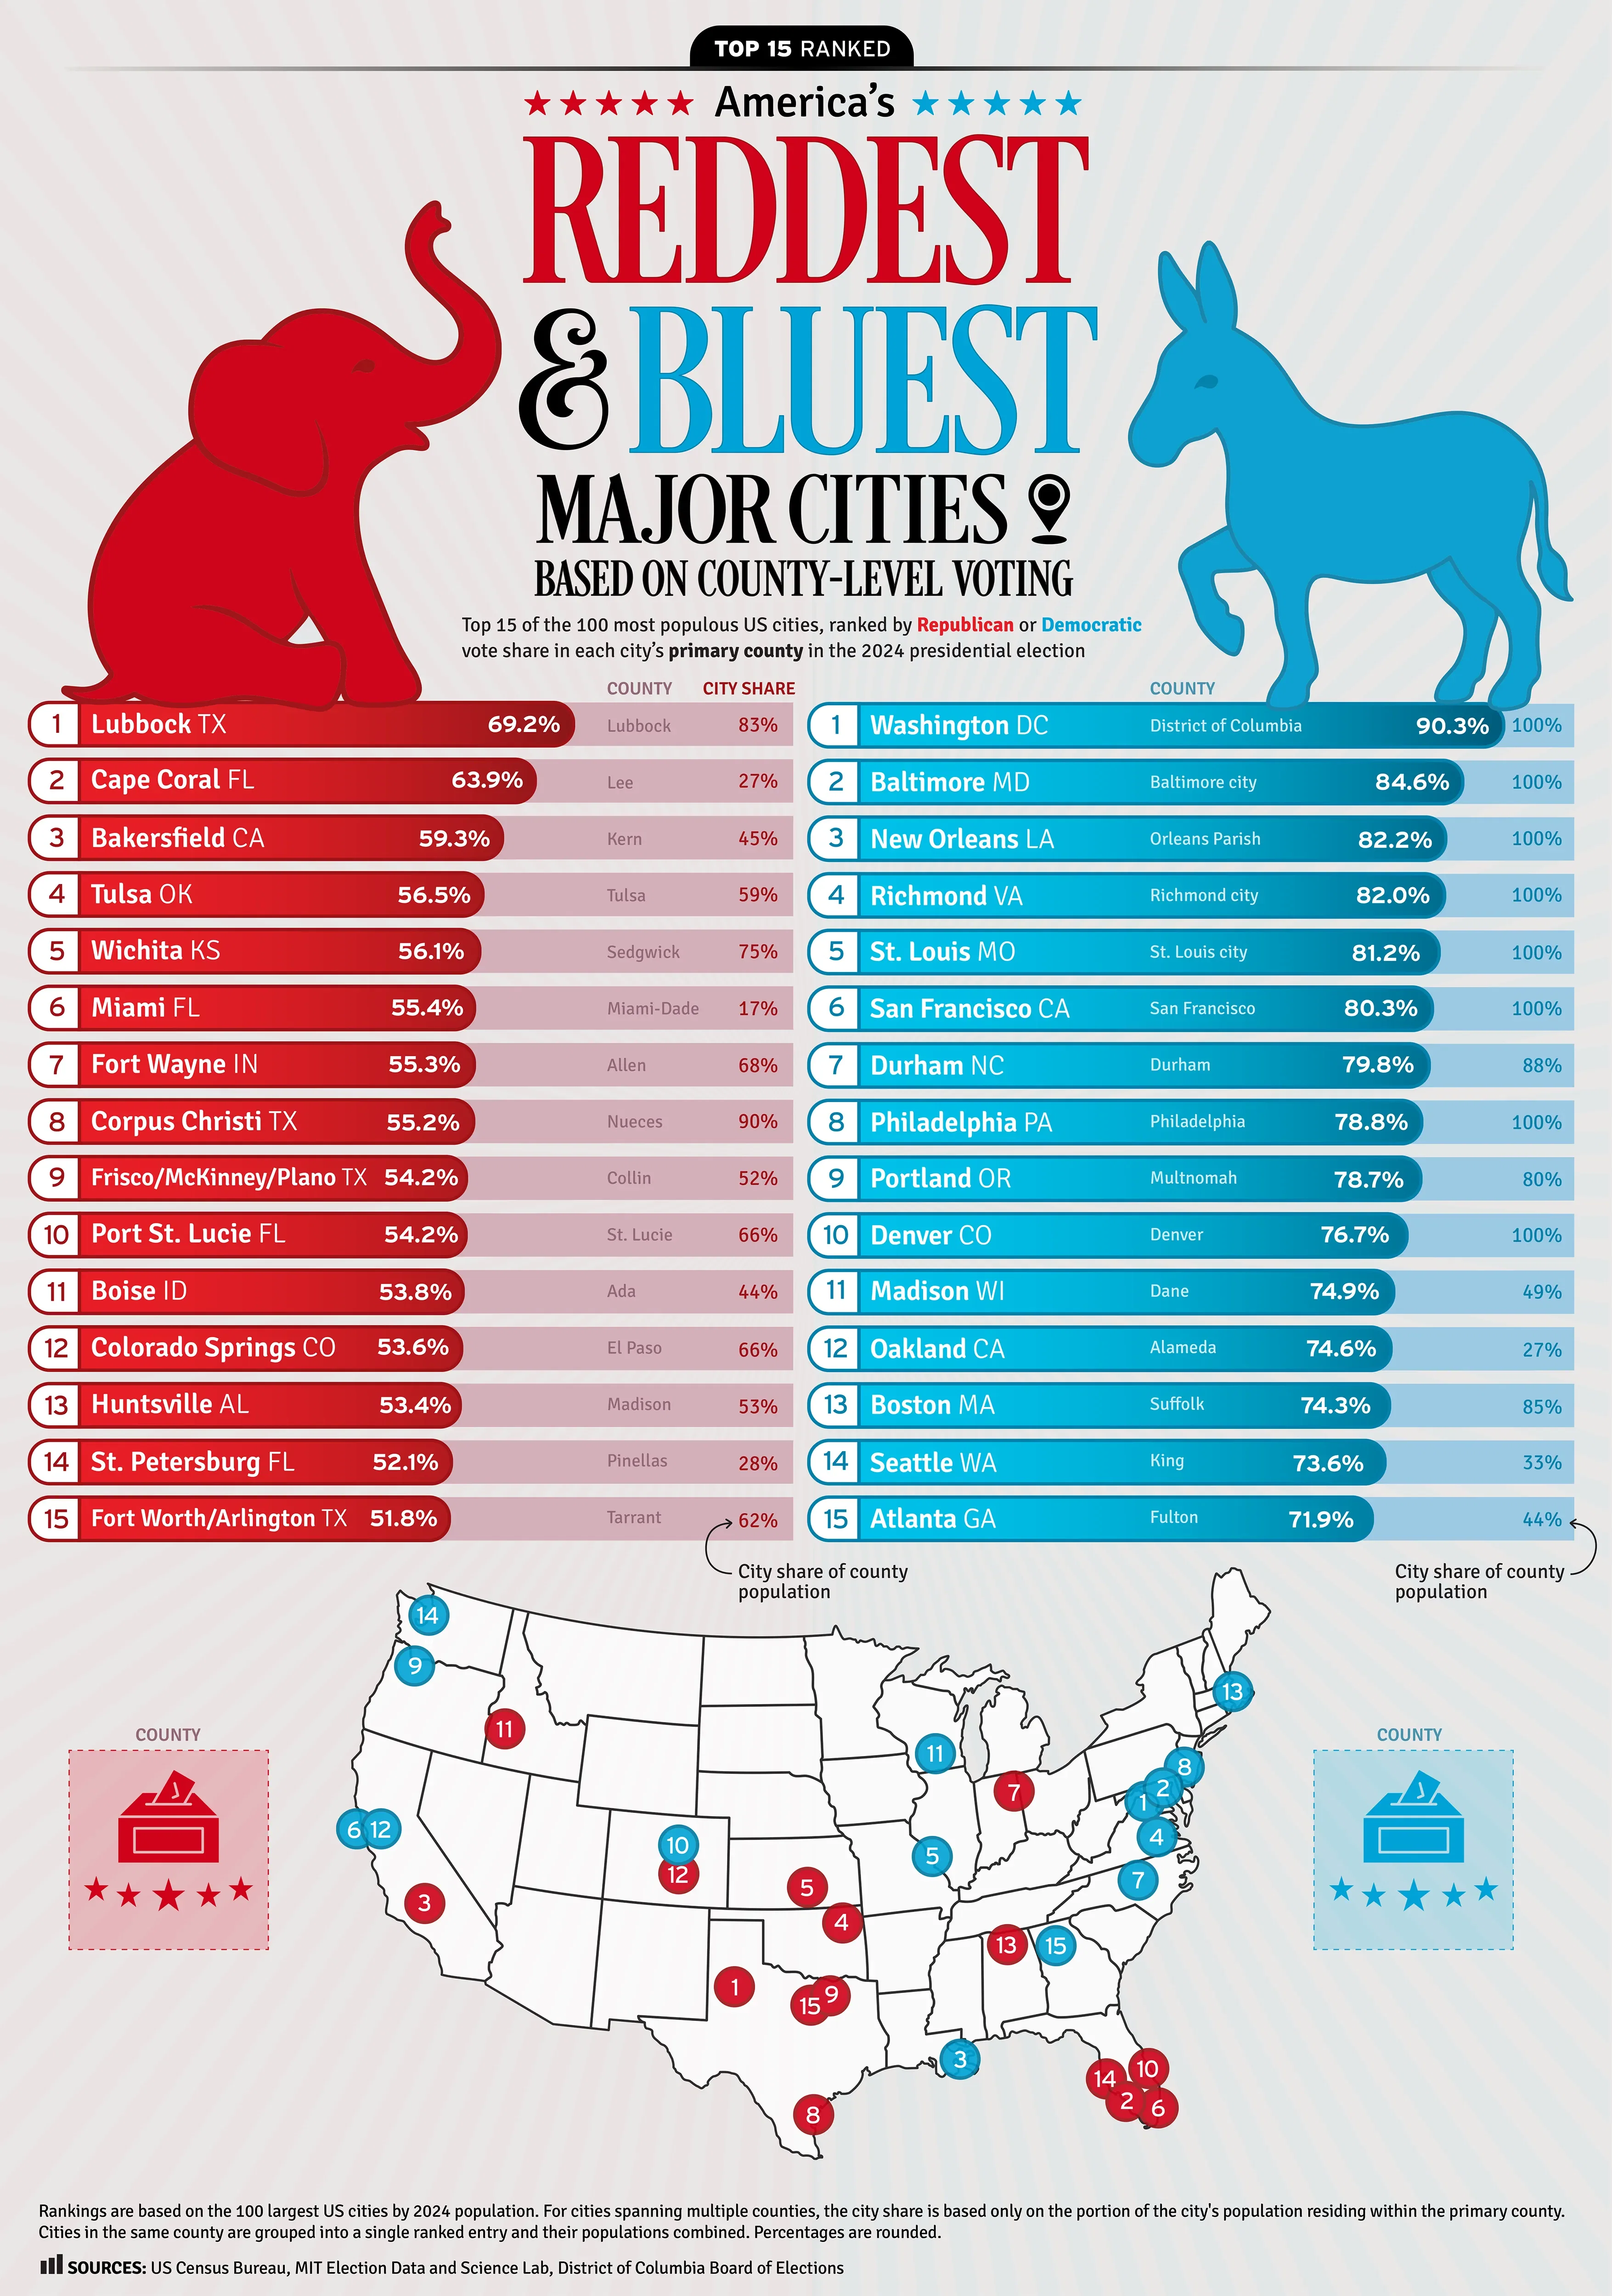
Among America’s 100 largest cities, which are located in the most Republican- and Democratic-voting counties? In other words, which of America’s major cities are in the reddest and bluest counties based on 2024 presidential election results? Using data from the MIT Election Data and Science Lab and the US Census Bureau, this chart ranks the Top 15 on each side by their primary county’s Republican or Democratic vote share.
To provide this context, the graphic shows each city’s share of its primary county’s population. For cities spanning multiple counties, only the portion of the city’s population residing within the primary county is included, using US Census Bureau Vintage 2024 county-place-part population estimates.
The relationship between a city and its county varies considerably. Many cities on the Democratic side account for a large share of their county population, and several occupy the same geographic area as their county or county equivalent: Baltimore, New Orleans, Richmond, St. Louis, San Francisco, Philadelphia, Denver and Washington, DC. By contrast, cities on the Republican side represent a much wider range of their counties’ populations—from Miami at just 17% of Miami-Dade County to Corpus Christi at 90% of Nueces County.
The two rankings reveal different geographic patterns. Texas and Florida are well represented on the Republican side, with four cities each, while many of the cities associated with the highest Democratic vote shares are concentrated in the Northeast. Colorado Springs and Denver, only about 70 miles apart, also appear on opposite sides of the ranking.
Because election results are measured at the county level, cities sharing the same primary county are grouped into a single ranked entry: Frisco/McKinney/Plano, TX, and Fort Worth/Arlington, TX.
The rankings represent county-level presidential election results and should not be interpreted as exact city-level election returns.
Methodology:
The 100 largest US cities were identified using the US Census Bureau’s Vintage 2024 Population Estimates. Each city was assigned to its primary county—the county containing the largest share of the city’s population—and matched by five-digit county FIPS code to 2024 presidential election returns from the MIT Election Data and Science Lab.
For cities extending into more than one county, only the county containing the largest share of the city’s population was used for the election ranking. These include Durham, Portland, Atlanta, Tulsa, Corpus Christi, Frisco/McKinney/Plano, Huntsville and Fort Worth/Arlington.
Cities sharing the same primary county were grouped into a single ranked entry. Frisco, McKinney and Plano were grouped under Collin County, TX, while Fort Worth and Arlington were grouped under Tarrant County, TX.
City share of county population is the portion of the primary county’s population represented by the listed city or cities. For cities spanning county boundaries, only residents within the primary county are included, using US Census Bureau Vintage 2024 county-place-part population estimates.
Because votes for third-party, independent and other candidates are included in the total, Republican and Democratic shares do not necessarily sum to 100%.
Washington, DC presidential results were sourced separately from the District of Columbia Board of Elections.
Percentages are rounded.