Where Data Tells the Story
© Voronoi 2026. All rights reserved.

Air quality levels have received a lot of attention in recent years.
In the wake of COVID-19 lockdowns, many places reported a marked increase in air quality. Northern India captured the world’s attention when it was reported that the Himalayan mountain range was visible for the first time in decades. On the flipside, later that summer, wildfires swept over the Pacific Northwest and California, blanketing entire regions with a thick shroud of smoke that spanned hundreds of miles.
How is air quality measured, and what goes into the health scores we see?
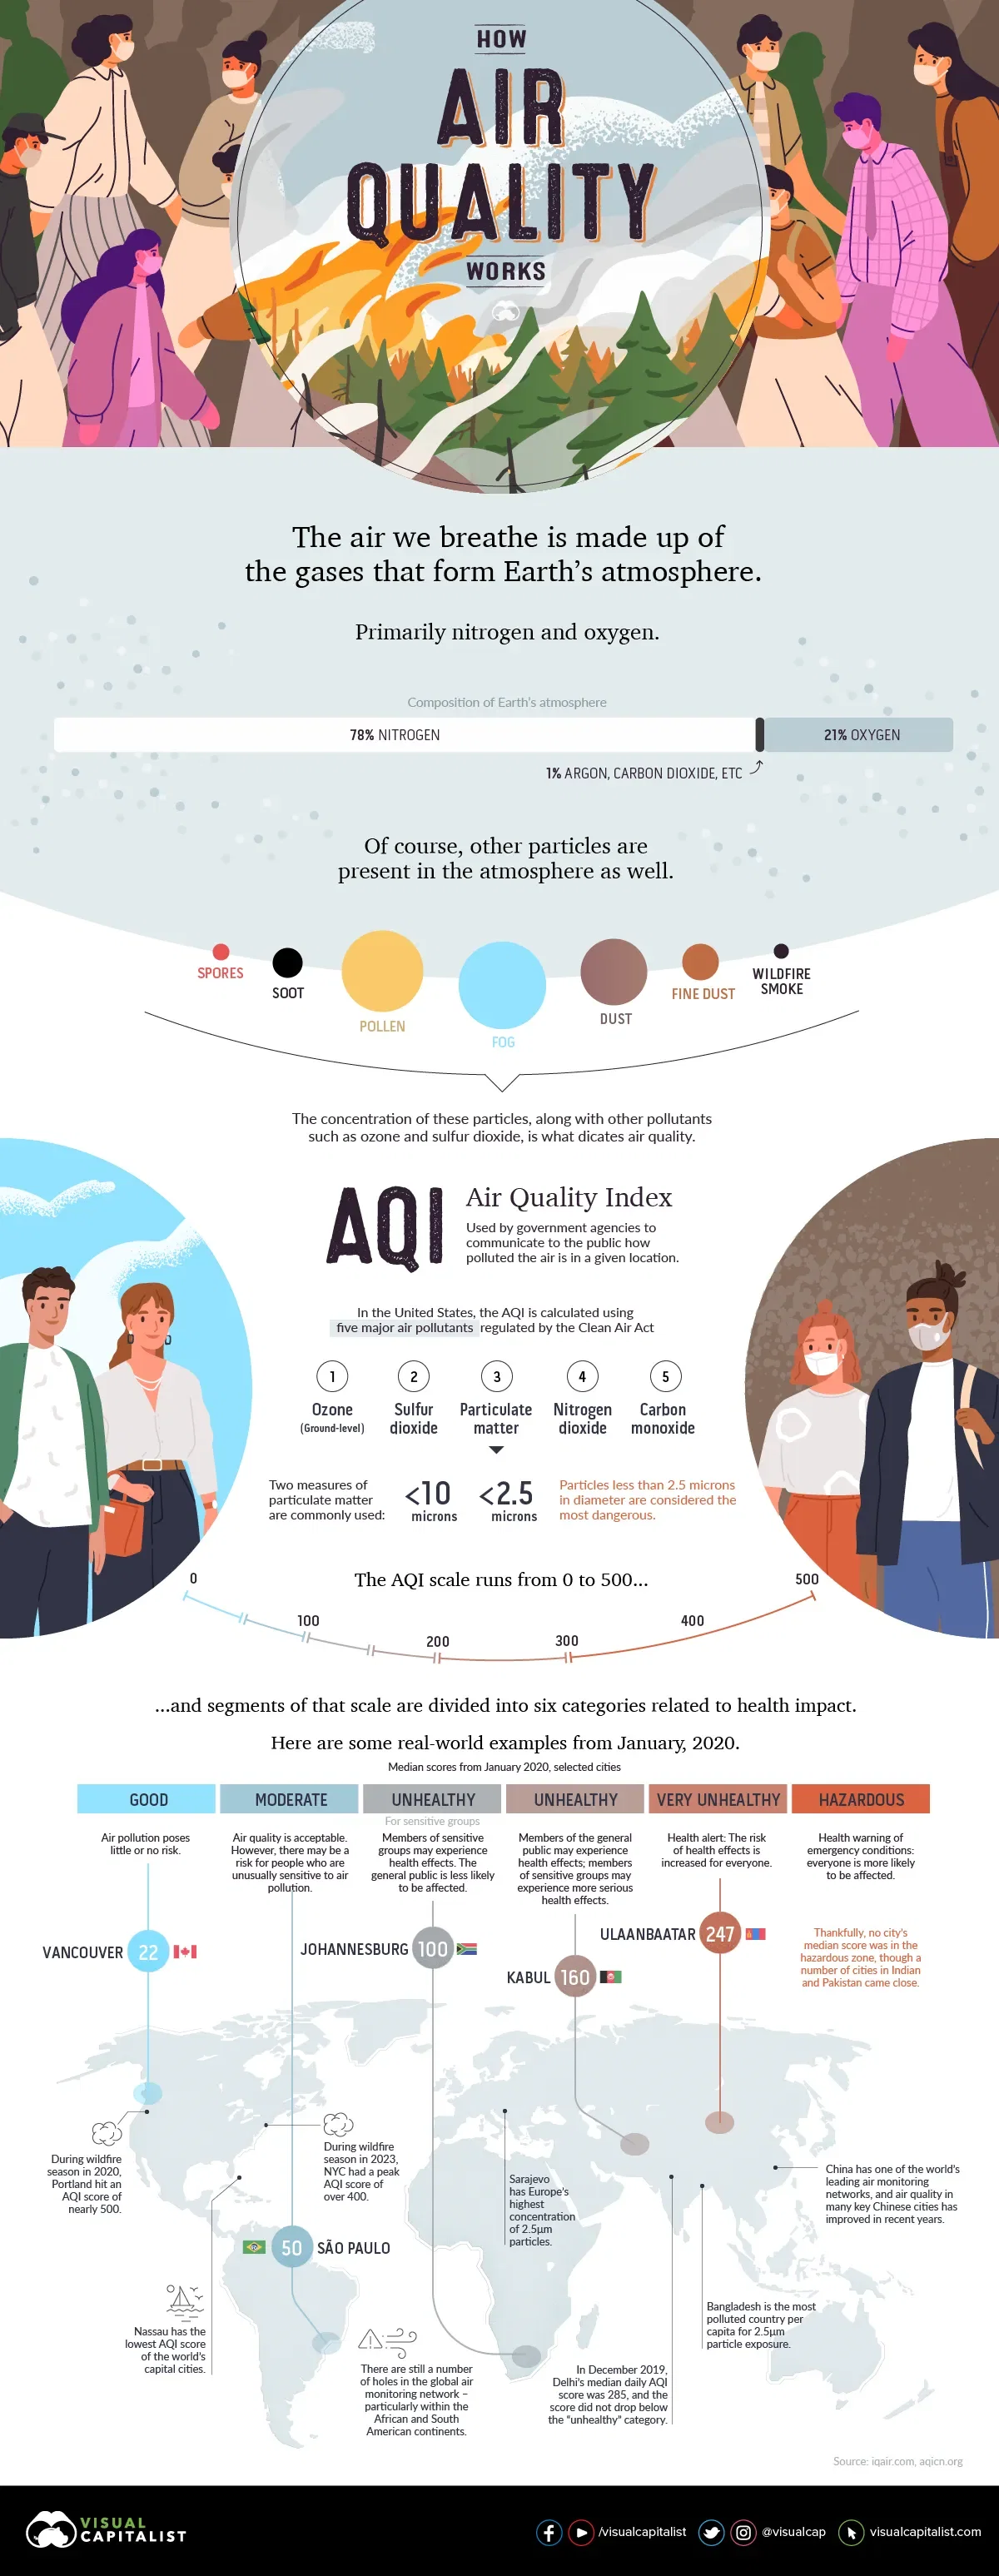
When we see that air quality is “good” or “unhealthy”, those public health categories are derived from the Air Quality Index (AQI).
In the U.S., the AQI is calculated using five major air pollutants regulated by the Clean Air Act:
Some countries have a slightly different way of calculating their scores. For example, India also measures levels of ammonia and lead in the air.
To make these readings more accessible, the AQI has a scoring system that runs from 0 to 500, using data collected from air monitoring stations in cities around the world. Scores below 50 are considered good, with very little impact to human health. The higher the score gets, the worse the air quality is.
While all the forms of atmospheric pollution are a cause for concern, it’s the smaller 2.5μm particles that get the most attention. For one, we can see visible evidence in the form of haze and smoke when PM2.5 levels increase. As well, these fine particles have a much easier time entering our bodies via breathing.
There are a number of factors that can increase the concentration of a region’s particulate matter. Some common examples include: