
Where Data Tells the Story
© Voronoi 2026. All rights reserved.

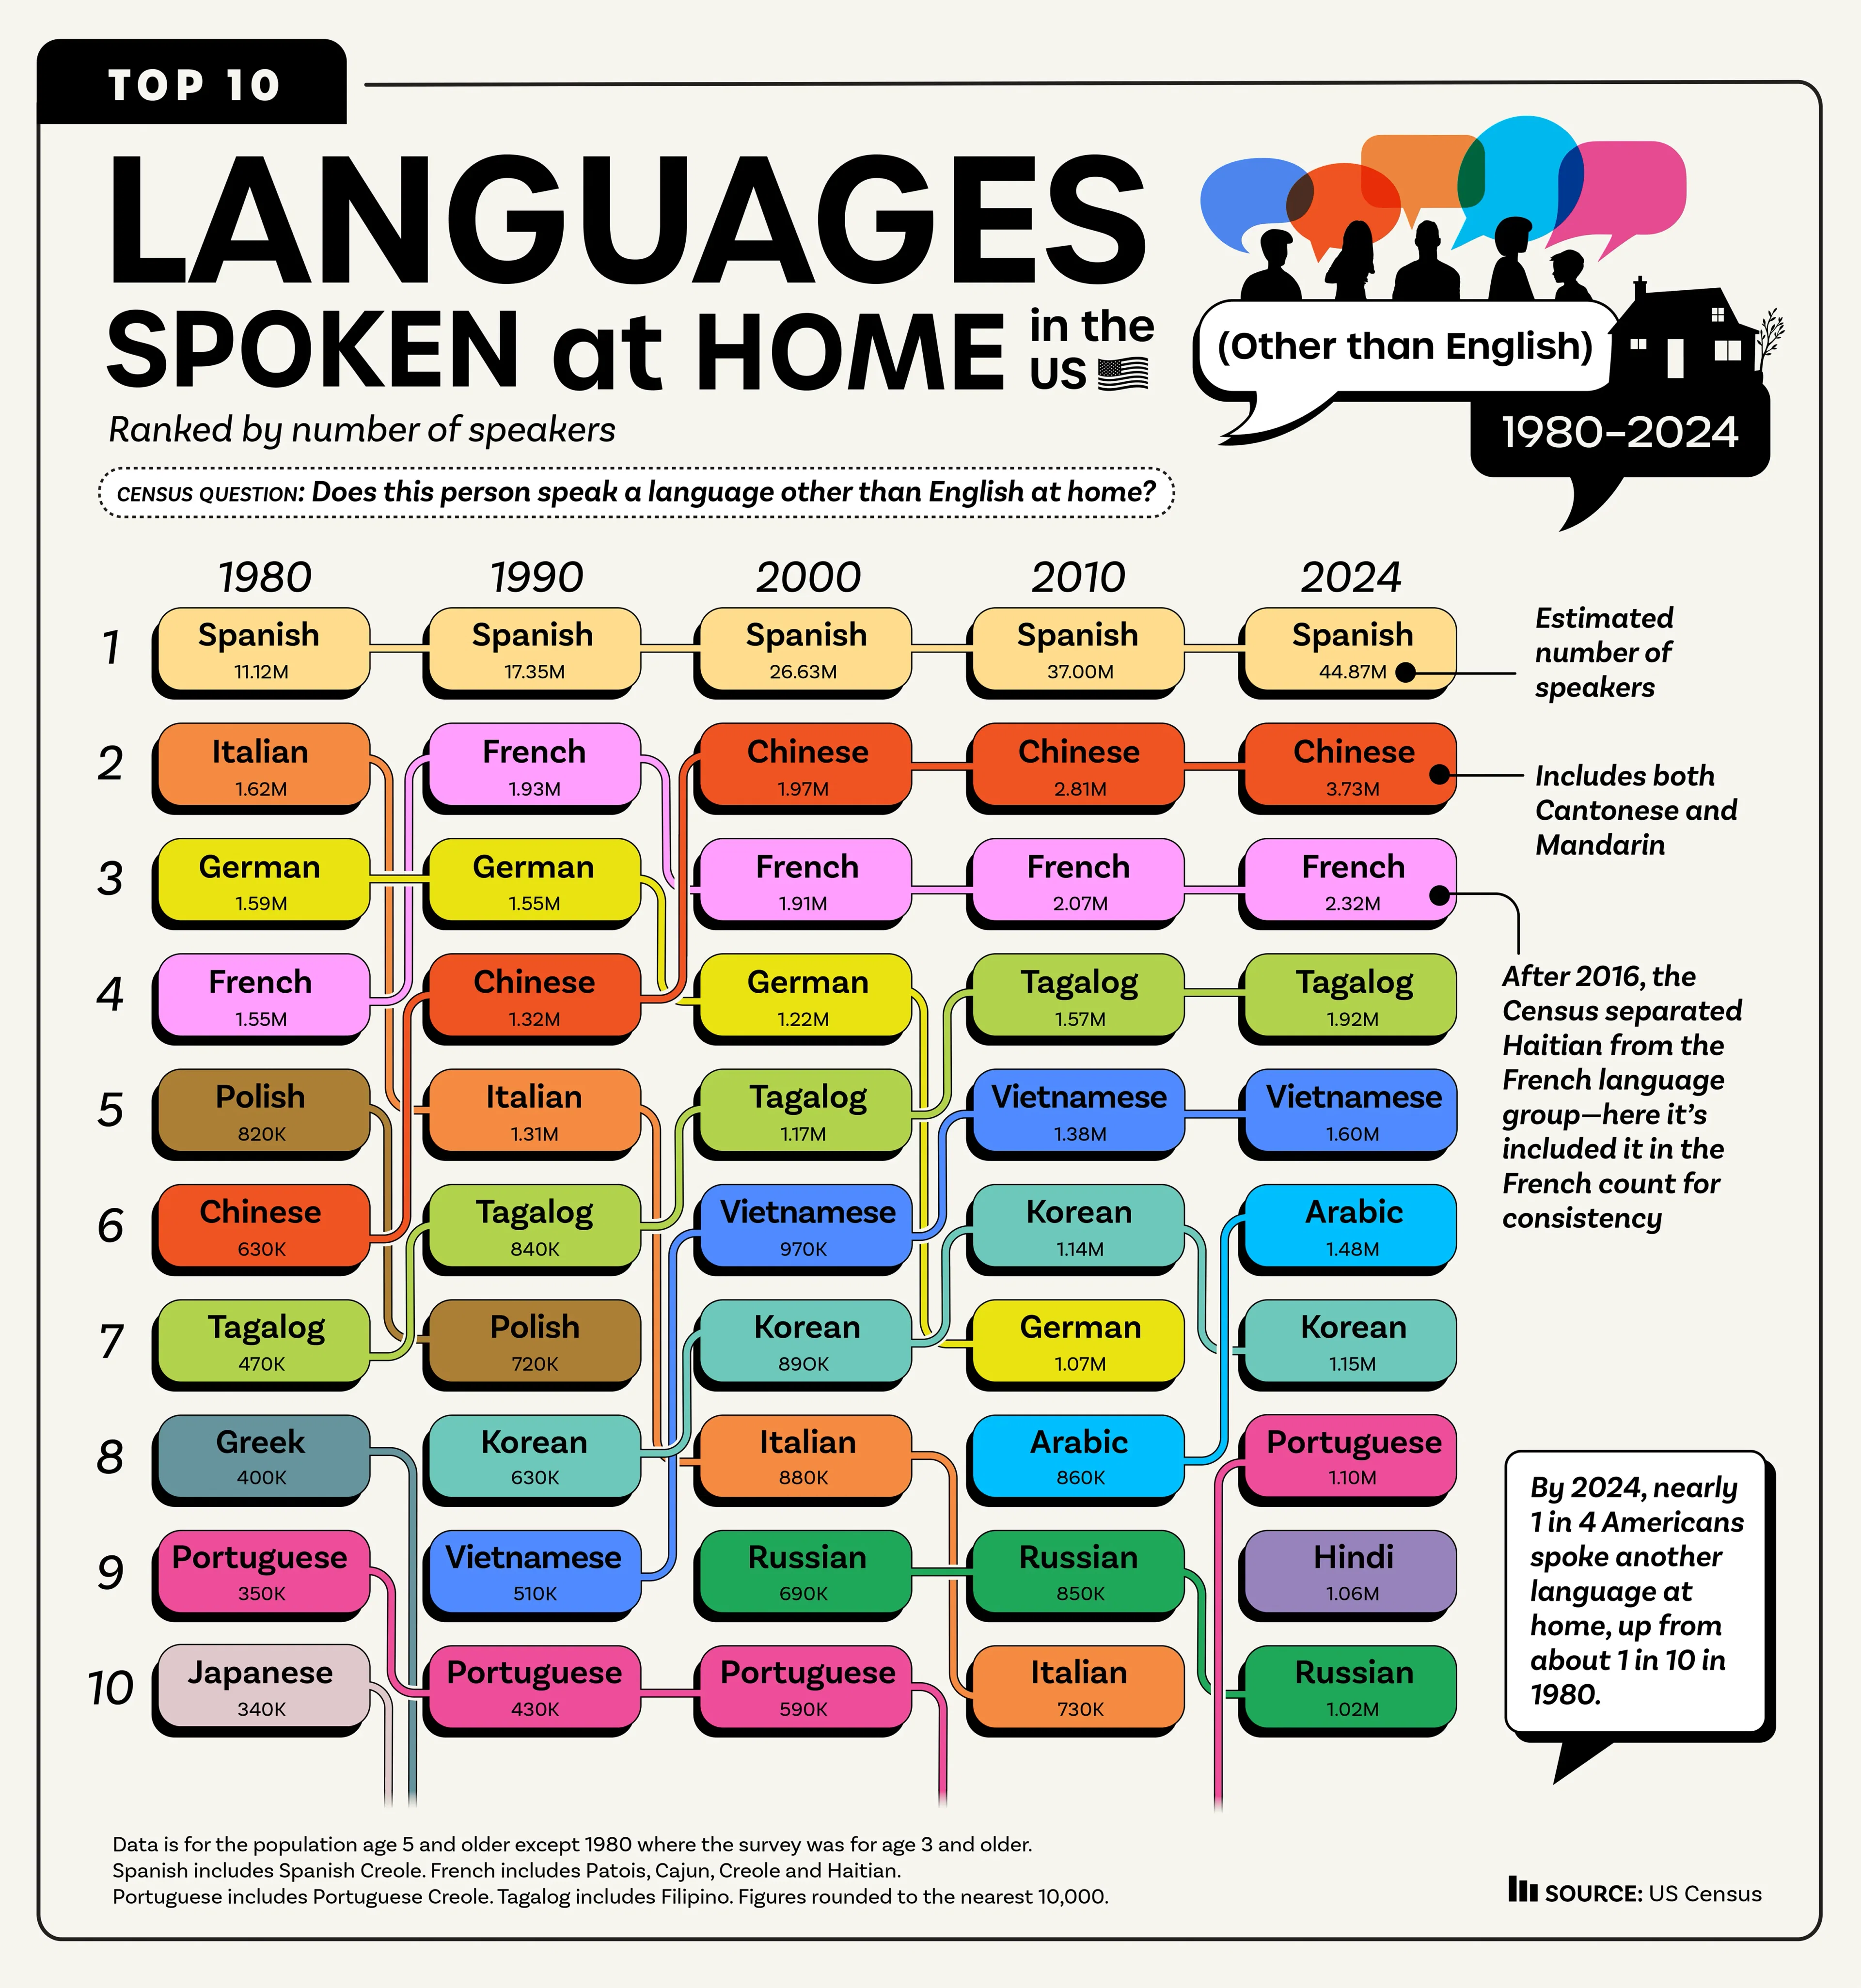
Using U.S. Census data on languages spoken at home other than English, this chart shows how the 10 most commonly spoken languages have shifted in rank since 1980. The Census question was: “Does this person speak another language at home?” and asked for the population age 5 and older. (Except in 1980 when it was age 3 and older.)
Spanish has held the No. 1 position throughout, while the languages occupying the remaining spots have changed substantially, reflecting shifts in immigration and the changing composition of the U.S. population.
In 1980, European languages dominated the top 10 (after Spanish of course), holding the next four spots—Italian, German, French and Polish—as well as the eighth and ninth positions, Greek and Portuguese. In recent years, Asian languages and Arabic have risen in the rankings. Chinese, which includes both Cantonese and Mandarin, has steadily risen since 1980. Portuguese fell out of the top 10 in 2010 (it actually ranked 11th), but returned in 2024. Hindi also entered the top 10 for the first time in 2024.
While some languages have gained speakers as immigration patterns have changed, others have declined. These changes can reflect shifts in immigration, aging immigrant populations, language shift and assimilation, and differences in the size of successive immigrant generations.
The overall number of people speaking a language other than English at home has increased substantially, from about 11% of the U.S. population in 1980 to 23% in 2024—or approximately 74 million people.
Note: In the 1980-2010 data, the Census Bureau grouped the Haitian language with French. Beginning with the 2016 American Community Survey, “Haitian” alone was reported as a separate language category. To maintain consistency in their classifications, Haitian is combined with French for 2024. In 2024, the Census estimated 1,041,231 Haitian speakers and 1,276,702 speakers of French (including Cajun).
Methodology: The 2024 data comes from the U.S. Census Bureau's American Community Survey (ACS) 1-year estimates, a nationwide survey that samples approximately 3.5 million addresses annually, including housing units and group quarters. The historical figures for 1980, 1990, 2000 and 2010 come from Census Bureau data and are estimates based on samples, so they are subject to sampling variability. The Census Bureau reports margins of error for these estimates. The numbers in the data table are therefore estimates of the U.S. population based on survey samples, rather than exact counts.