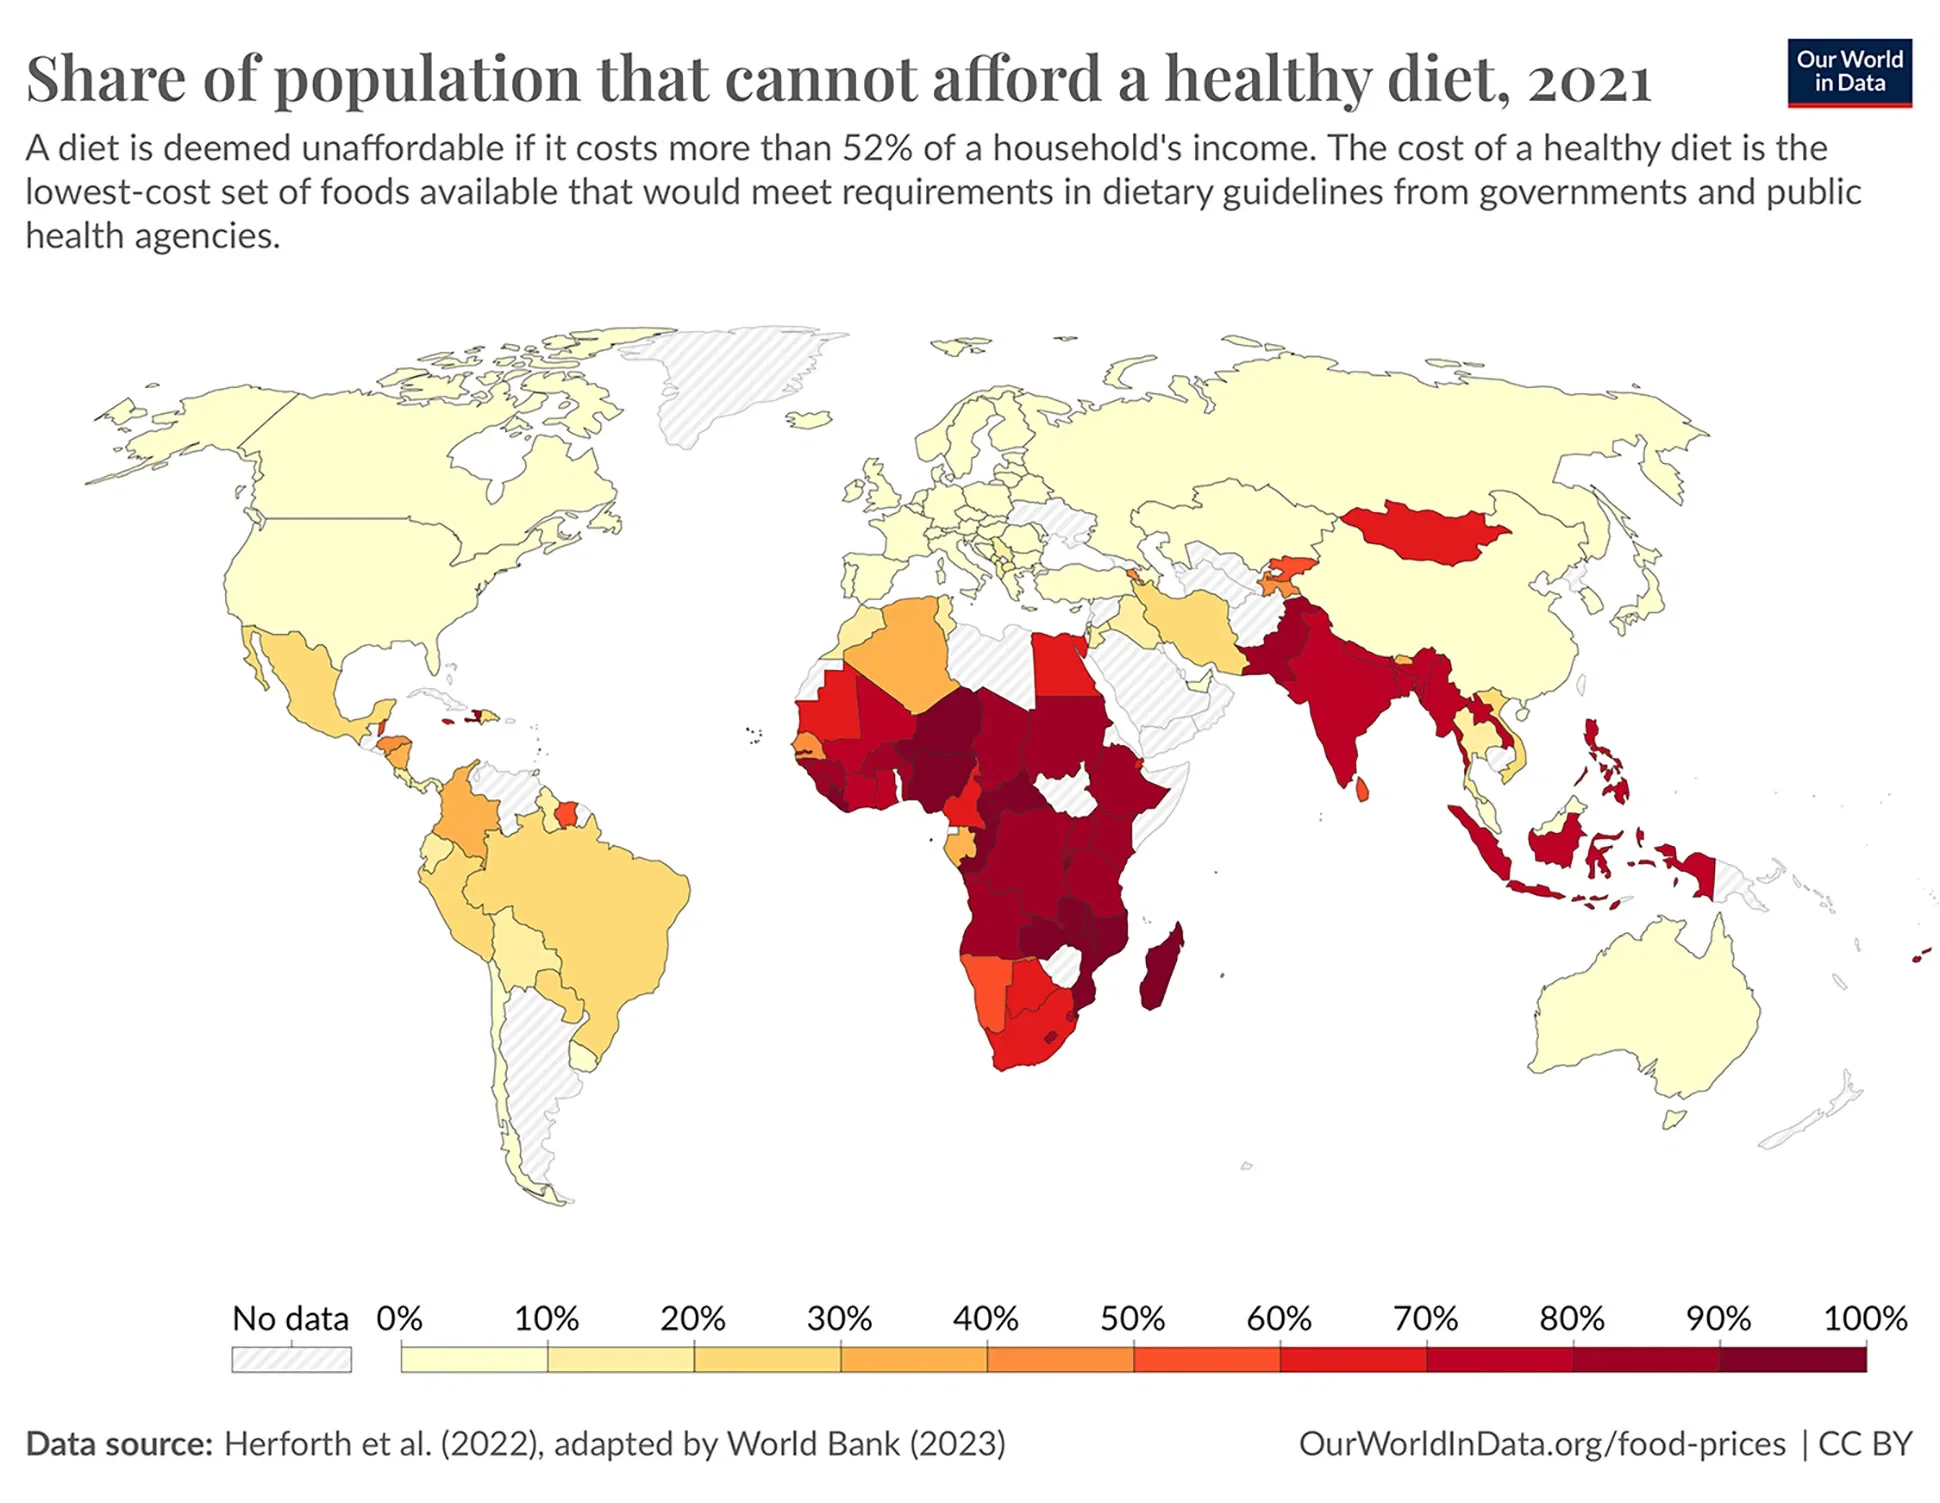
Three billion People Cannot Afford a Healthy Diet
What people really need is a diverse and nutritious diet. Getting enough calories is important, but it is not sufficient to live a healthy and productive life. Eating only cereals and starchy foods will leave you deficient in protein, essential fats and the wide range of micronutrients that our bodies need to function optimally.
Most countries develop ‘food-based dietary guidelines’ which provide recommendations on what a ‘healthy diet’ would look like. This includes guidelines on what balance of foods across the many groups – cereals, fruits, vegetables, legumes, meat and dairy – is considered best for long-term health.
The researchers also looked at the lowest-cost options to meet these national food-based dietary guidelines. Of course, there is no universal ‘healthy diet’, particularly when we consider the strong cultural differences in what people eat. So, the researchers selected dietary guidelines which were regionally representative: this means we’re not expecting that people in India or Japan will adopt the national dietary guidelines of the United States, or vice versa.
Unsurprisingly, a diverse, healthy diet is much more expensive than a calorie-sufficient one. The researchers found that the average cost across the world was $3.54 per day. That’s more than four times higher.
When we put these prices in the context of affordability – again defining this as spending 52% of our income on food – we find that three billion people cannot afford a healthy diet. In many of the world’s poorest countries – particularly across Sub-Saharan Africa – it’s unaffordable (or not producible) for most of the population. This is shown in the map which gives these figures as a percentage of the total population. In many countries, a healthy diet is out-of-reach for more than 90%.
Dataset
Entity | Year | Share of the population who cannot afford a healthy diet |
---|---|---|
Albania | 2021 | 15.7 |
Algeria | 2021 | 32.2 |
Angola | 2021 | 88.1 |
Armenia | 2021 | 41.4 |
Australia | 2021 | 0.7 |
Austria | 2021 | 0.9 |
Azerbaijan | 2021 | 0 |
Bangladesh | 2021 | 73.9 |
Belarus | 2021 | 0.5 |
Belgium | 2021 | 0.1 |
Belize | 2021 | 53 |
Benin | 2021 | 82.6 |
Bhutan | 2021 | 30.5 |
Bolivia | 2021 | 15.1 |
Bosnia and Herzegovina | 2021 | 3 |
Botswana | 2021 | 60.2 |
Brazil | 2021 | 22.4 |
Bulgaria | 2021 | 4.2 |
Burkina Faso | 2021 | 83.4 |
Burundi | 2021 | 95.9 |
Cameroon | 2021 | 60.5 |
Canada | 2021 | 0.7 |
Cape Verde | 2021 | 40.4 |
Central African Republic | 2021 | 95.8 |
Chad | 2021 | 83.1 |
Chile | 2021 | 3.5 |
China | 2021 | 9.1 |
Colombia | 2021 | 31.3 |
Congo | 2021 | 91.5 |
Congo | 2020 | 90.8 |
Costa Rica | 2021 | 14.4 |
Costa Rica | 2020 | 21 |
Cote d'Ivoire | 2021 | 73 |
Cote d'Ivoire | 2020 | 72.8 |
Croatia | 2021 | 1.8 |
Croatia | 2020 | 3.3 |
Cyprus | 2021 | 0 |
Cyprus | 2020 | 0.1 |
Czechia | 2021 | 0.1 |
Czechia | 2020 | 0.1 |
Democratic Republic of Congo | 2021 | 85.5 |
Democratic Republic of Congo | 2020 | 87.2 |
Denmark | 2021 | 0.2 |
Denmark | 2020 | 0.3 |
Djibouti | 2021 | 65.3 |
Djibouti | 2020 | 66.7 |
Dominican Republic | 2021 | 25.8 |
Dominican Republic | 2020 | 25 |
Ecuador | 2021 | 19.7 |
Ecuador | 2020 | 25.1 |
Egypt | 2021 | 60.4 |
Egypt | 2020 | 62.9 |
Estonia | 2021 | 0.8 |
Estonia | 2020 | 1.1 |
Eswatini | 2021 | 73.8 |
Eswatini | 2020 | 75.3 |
Ethiopia | 2021 | 83.9 |
Ethiopia | 2020 | 83.3 |
Fiji | 2021 | 73.1 |
Fiji | 2020 | 66.8 |
Finland | 2021 | 0 |
Finland | 2020 | 0.1 |
France | 2021 | 0.2 |
France | 2020 | 0.3 |
Gabon | 2021 | 30.3 |
Gabon | 2020 | 30.3 |
Gambia | 2021 | 72.2 |
Gambia | 2020 | 71.8 |
Germany | 2021 | 0.2 |
Germany | 2020 | 0.2 |
Ghana | 2021 | 77.3 |
Ghana | 2020 | 78.1 |
Greece | 2021 | 2.2 |
Greece | 2020 | 2.7 |
Guinea | 2021 | 88.9 |
Guinea | 2020 | 88.5 |
Guinea-Bissau | 2021 | 84.6 |
Guinea-Bissau | 2020 | 83.9 |
Guyana | 2021 | 18.5 |
Guyana | 2020 | 24.9 |
Haiti | 2021 | 89.5 |
Haiti | 2020 | 88.9 |
Honduras | 2021 | 44.8 |
Honduras | 2020 | 49.7 |
Hungary | 2021 | 1.5 |
Hungary | 2020 | 2 |
Iceland | 2021 | 0 |
Iceland | 2020 | 0 |
India | 2021 | 72 |
India | 2020 | 74.3 |
Indonesia | 2021 | 70.8 |
Indonesia | 2020 | 70.2 |
Iran | 2021 | 28.8 |
Iran | 2020 | 24.9 |
Iraq | 2021 | 18.8 |
Iraq | 2020 | 19.2 |
Ireland | 2021 | 0.1 |
Ireland | 2020 | 0.2 |
Israel | 2021 | 1.2 |
Israel | 2020 | 1.2 |
Italy | 2021 | 1.5 |
Italy | 2020 | 1.8 |
Jamaica | 2021 | 62.6 |
Jamaica | 2020 | 63.9 |
Japan | 2021 | 2.4 |
Japan | 2020 | 2.7 |
Jordan | 2021 | 16 |
Jordan | 2020 | 16.7 |
Kazakhstan | 2021 | 2.6 |
Kazakhstan | 2020 | 2.6 |
Kenya | 2021 | 86.5 |
Kenya | 2020 | 85.2 |
Kyrgyzstan | 2021 | 56.9 |
Kyrgyzstan | 2020 | 55.3 |
Laos | 2021 | 74.1 |
Laos | 2020 | 74.9 |
Latvia | 2021 | 1.5 |
Latvia | 2020 | 1.9 |
Lesotho | 2021 | 88.8 |
Lesotho | 2020 | 87.8 |
Liberia | 2021 | 92.8 |
Liberia | 2020 | 91.6 |
Lithuania | 2021 | 0.7 |
Lithuania | 2020 | 1.1 |
Luxembourg | 2021 | 0 |
Luxembourg | 2020 | 0 |
Madagascar | 2021 | 97.8 |
Madagascar | 2020 | 97.8 |
Malawi | 2021 | 95.9 |
Malawi | 2020 | 95.7 |
Malaysia | 2021 | 2.5 |
Malaysia | 2020 | 2.8 |
Maldives | 2021 | 2.8 |
Maldives | 2020 | 8.9 |
Mali | 2021 | 71.4 |
Mali | 2020 | 70.8 |
Malta | 2021 | 0.8 |
Malta | 2020 | 0.8 |
Mauritania | 2021 | 62.4 |
Mauritania | 2020 | 60.9 |
Mauritius | 2021 | 14.5 |
Mauritius | 2020 | 15.1 |
Mexico | 2021 | 20.2 |
Mexico | 2020 | 23.1 |
Moldova | 2021 | 3.7 |
Moldova | 2020 | 7.2 |
Mongolia | 2021 | 61.1 |
Mongolia | 2020 | 57.1 |
Montenegro | 2021 | 13.7 |
Montenegro | 2020 | 17.3 |
Morocco | 2021 | 19.5 |
Morocco | 2020 | 22.2 |
Mozambique | 2021 | 94.8 |
Mozambique | 2020 | 94.4 |
Myanmar | 2021 | 74.3 |
Myanmar | 2020 | 65.5 |
Namibia | 2021 | 59.4 |
Namibia | 2020 | 59 |
Nepal | 2021 | 71.4 |
Nepal | 2020 | 74.2 |
Netherlands | 2021 | 0.1 |
Netherlands | 2020 | 0.2 |
Nicaragua | 2021 | 34 |
Nicaragua | 2020 | 37.1 |
Niger | 2021 | 92 |
Niger | 2020 | 91 |
Nigeria | 2021 | 93.6 |
Nigeria | 2020 | 93.2 |
North Macedonia | 2021 | 15.9 |
North Macedonia | 2020 | 17.5 |
Norway | 2021 | 0.3 |
Norway | 2020 | 0.5 |
Pakistan | 2021 | 80.1 |
Pakistan | 2020 | 83.2 |
Palestine | 2021 | 15.3 |
Palestine | 2020 | 20.1 |
Panama | 2021 | 17 |
Panama | 2020 | 20.5 |
Paraguay | 2021 | 20.4 |
Paraguay | 2020 | 20.3 |
Peru | 2021 | 25.6 |
Peru | 2020 | 34.2 |
Philippines | 2021 | 74.1 |
Philippines | 2020 | 74.1 |
Poland | 2021 | 4 |
Poland | 2020 | 1.3 |
Portugal | 2021 | 1.2 |
Portugal | 2020 | 1.4 |
Romania | 2021 | 7 |
Romania | 2020 | 8.4 |
Russia | 2021 | 2.6 |
Russia | 2020 | 2.8 |
Rwanda | 2021 | 82 |
Rwanda | 2020 | 84.6 |
Saint Lucia | 2021 | 27.2 |
Saint Lucia | 2020 | 31.6 |
Sao Tome and Principe | 2021 | 78.2 |
Sao Tome and Principe | 2020 | 77.3 |
Senegal | 2021 | 44.8 |
Senegal | 2020 | 46.4 |
Serbia | 2021 | 10.3 |
Serbia | 2020 | 13 |
Seychelles | 2021 | 7.5 |
Seychelles | 2020 | 7.5 |
Sierra Leone | 2021 | 83.5 |
Sierra Leone | 2020 | 82.5 |
Slovakia | 2021 | 1.2 |
Slovakia | 2020 | 1.4 |
Slovenia | 2021 | 0 |
Slovenia | 2020 | 0 |
South Africa | 2021 | 66.7 |
South Africa | 2020 | 67 |
South Korea | 2021 | 2 |
South Korea | 2020 | 2.2 |
Spain | 2021 | 1.8 |
Spain | 2020 | 2 |
Sri Lanka | 2021 | 58.2 |
Sri Lanka | 2020 | 56.8 |
Sudan | 2021 | 85.6 |
Sudan | 2020 | 94.1 |
Suriname | 2021 | 58.6 |
Suriname | 2020 | 54.3 |
Sweden | 2021 | 0.6 |
Sweden | 2020 | 0.8 |
Switzerland | 2021 | 0 |
Switzerland | 2020 | 0 |
Tajikistan | 2021 | 45.8 |
Tajikistan | 2020 | 49.4 |
Tanzania | 2021 | 85 |
Tanzania | 2020 | 85.1 |
Thailand | 2021 | 18 |
Thailand | 2020 | 19.8 |
Trinidad and Tobago | 2021 | 9.9 |
Trinidad and Tobago | 2020 | 9.1 |
Tunisia | 2021 | 17.2 |
Tunisia | 2020 | 18.1 |
Turkey | 2021 | 5.8 |
Turkey | 2020 | 6.9 |
Uganda | 2021 | 82.2 |
Uganda | 2020 | 82.6 |
United Arab Emirates | 2021 | 0.1 |
United Arab Emirates | 2020 | 0.2 |
United Kingdom | 2021 | 0.4 |
United Kingdom | 2020 | 0.5 |
United States | 2021 | 1 |
United States | 2020 | 1.2 |
Uruguay | 2021 | 5.2 |
Uruguay | 2020 | 5.3 |
Vietnam | 2021 | 21 |
Vietnam | 2020 | 21.9 |
Zambia | 2021 | 90.1 |
Zambia | 2020 | 89.7 |
Data sources
Herforth et al. (2022), adapted by World Bank (2023) – processed by Our World in Data. “Share of the population who cannot afford a healthy diet” [dataset]. Herforth et al. (2022), adapted by World Bank, “Food Prices for Nutrition 2.1” [original data].