Where Data Tells the Story
© Voronoi 2026. All rights reserved.
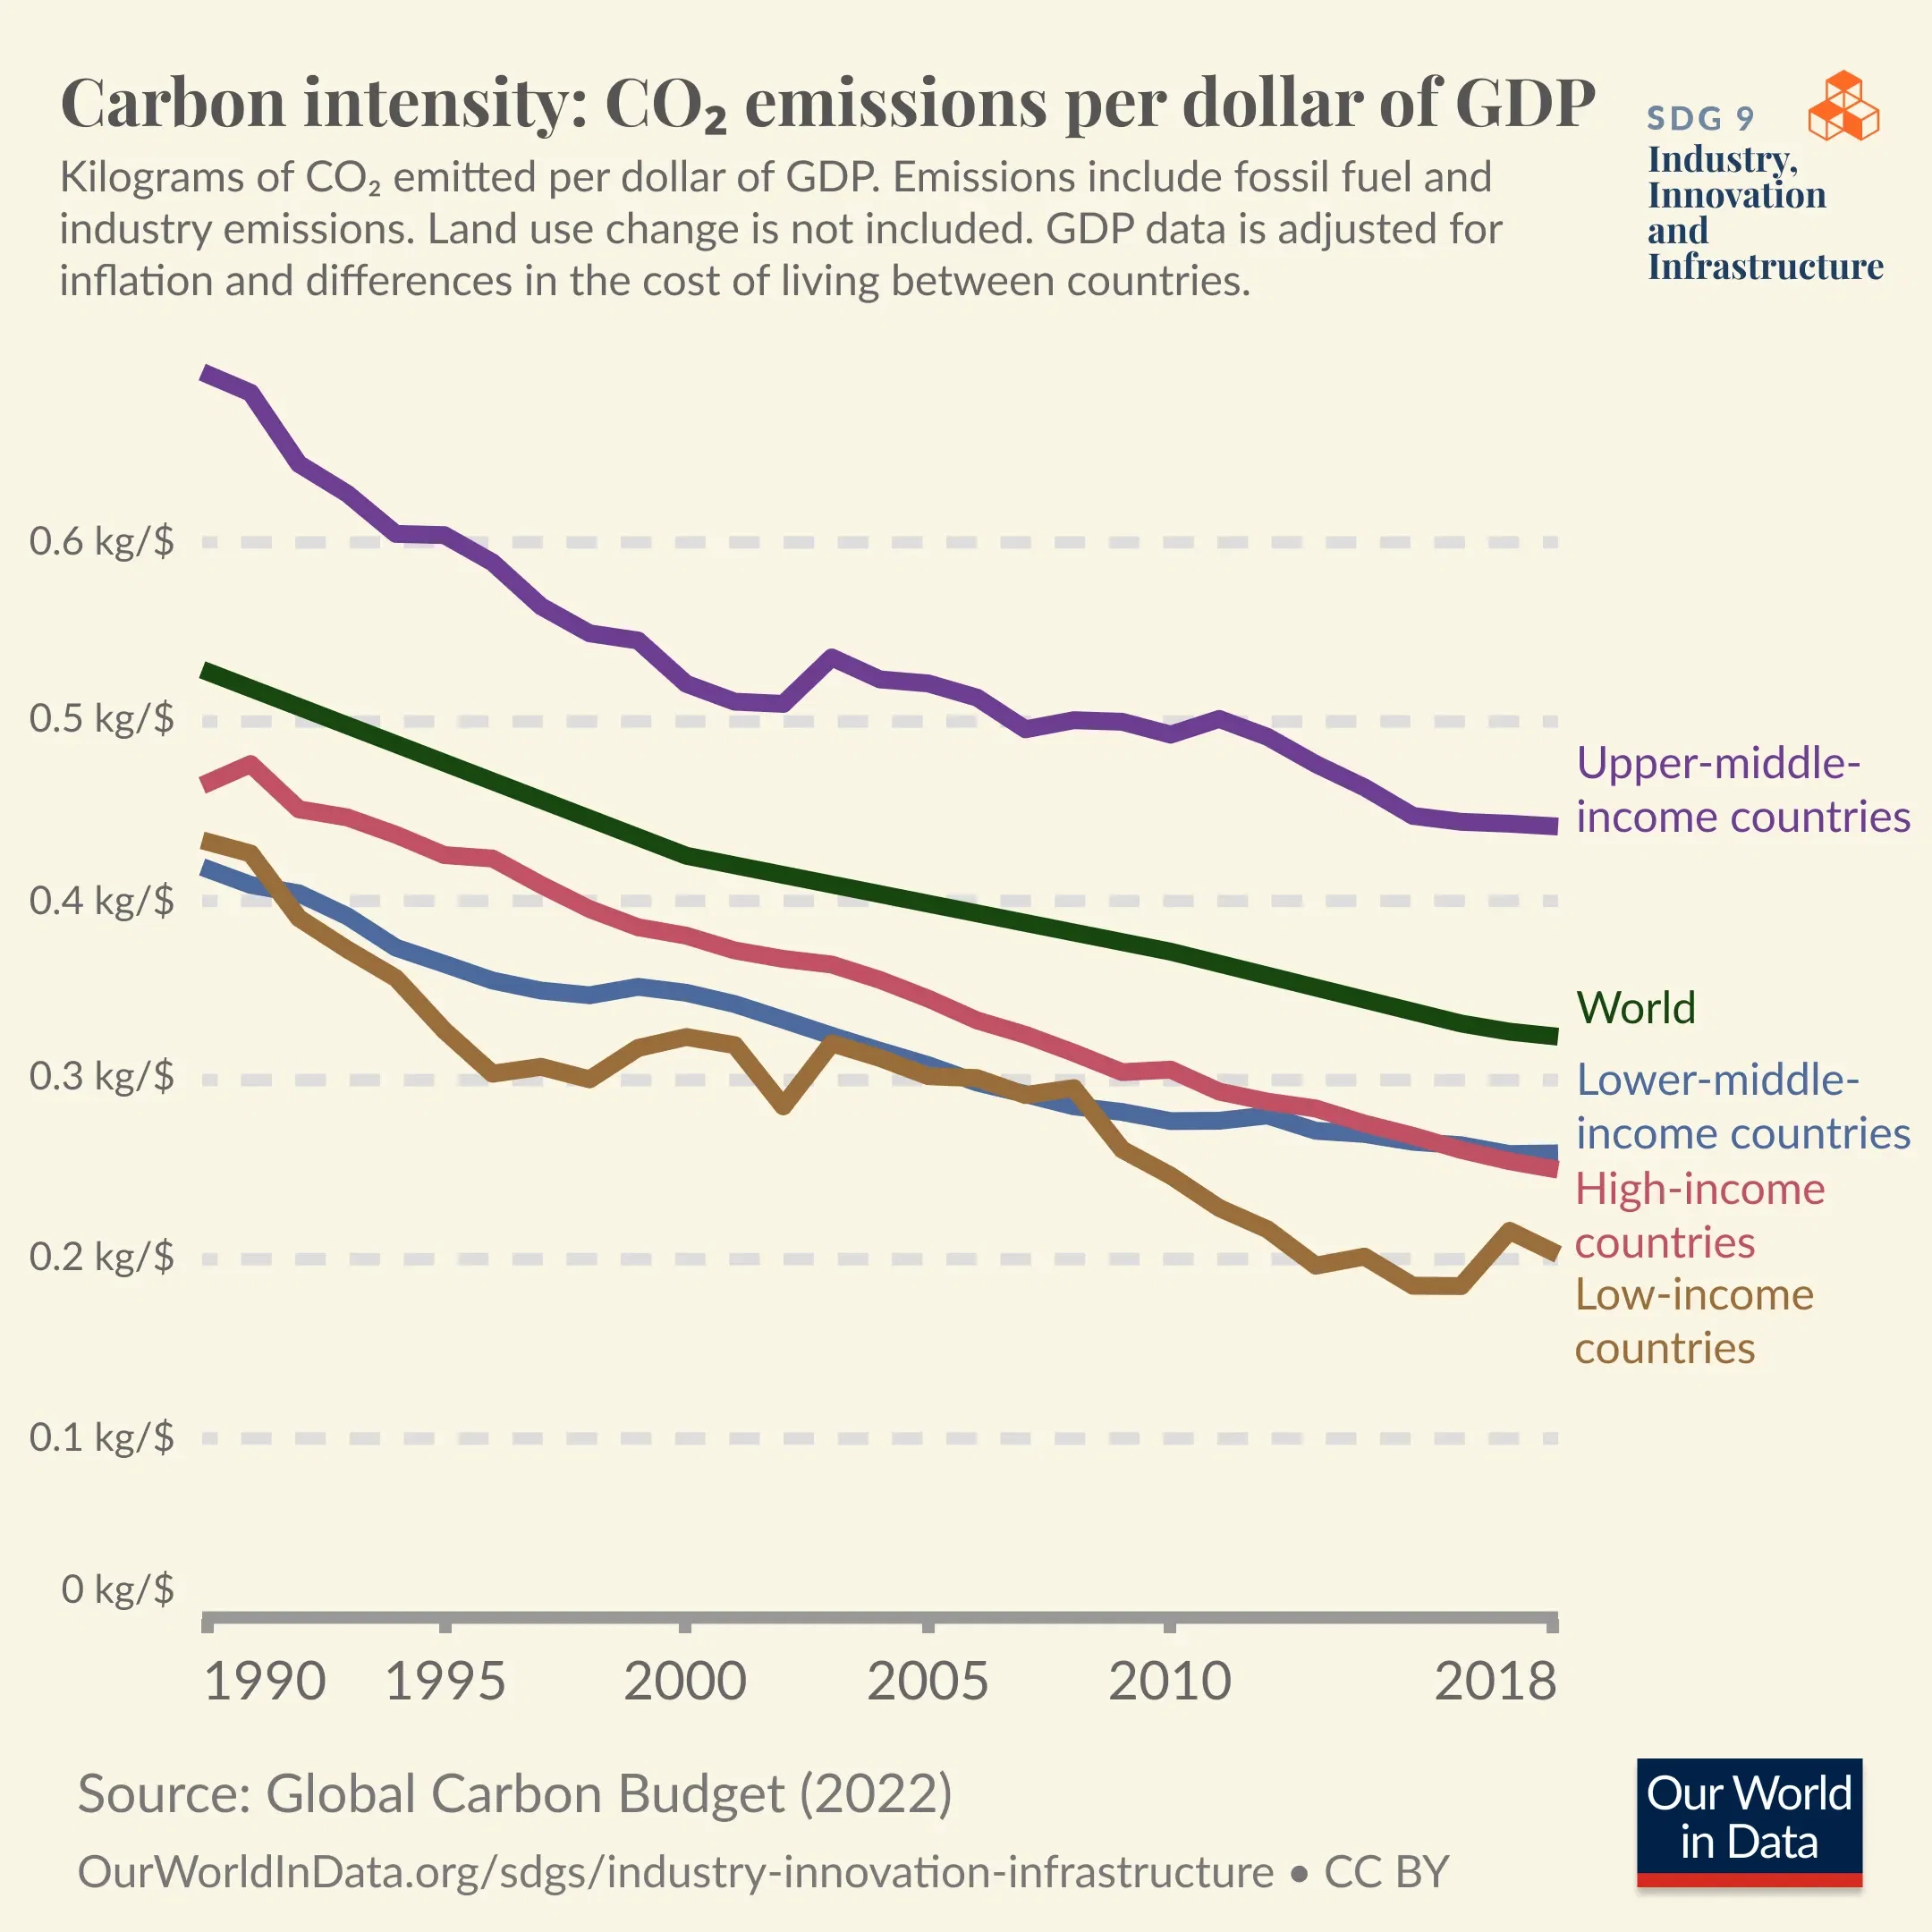
The chart above measures carbon intensity. It reports the quantity of carbon dioxide emitted per unit of economic value (kilograms of CO2 emitted per dollar of GDP). Groups of nations across all income levels have seen a decline in carbon intensity.