Where Data Tells the Story
© Voronoi 2026. All rights reserved.
What We’re Showing
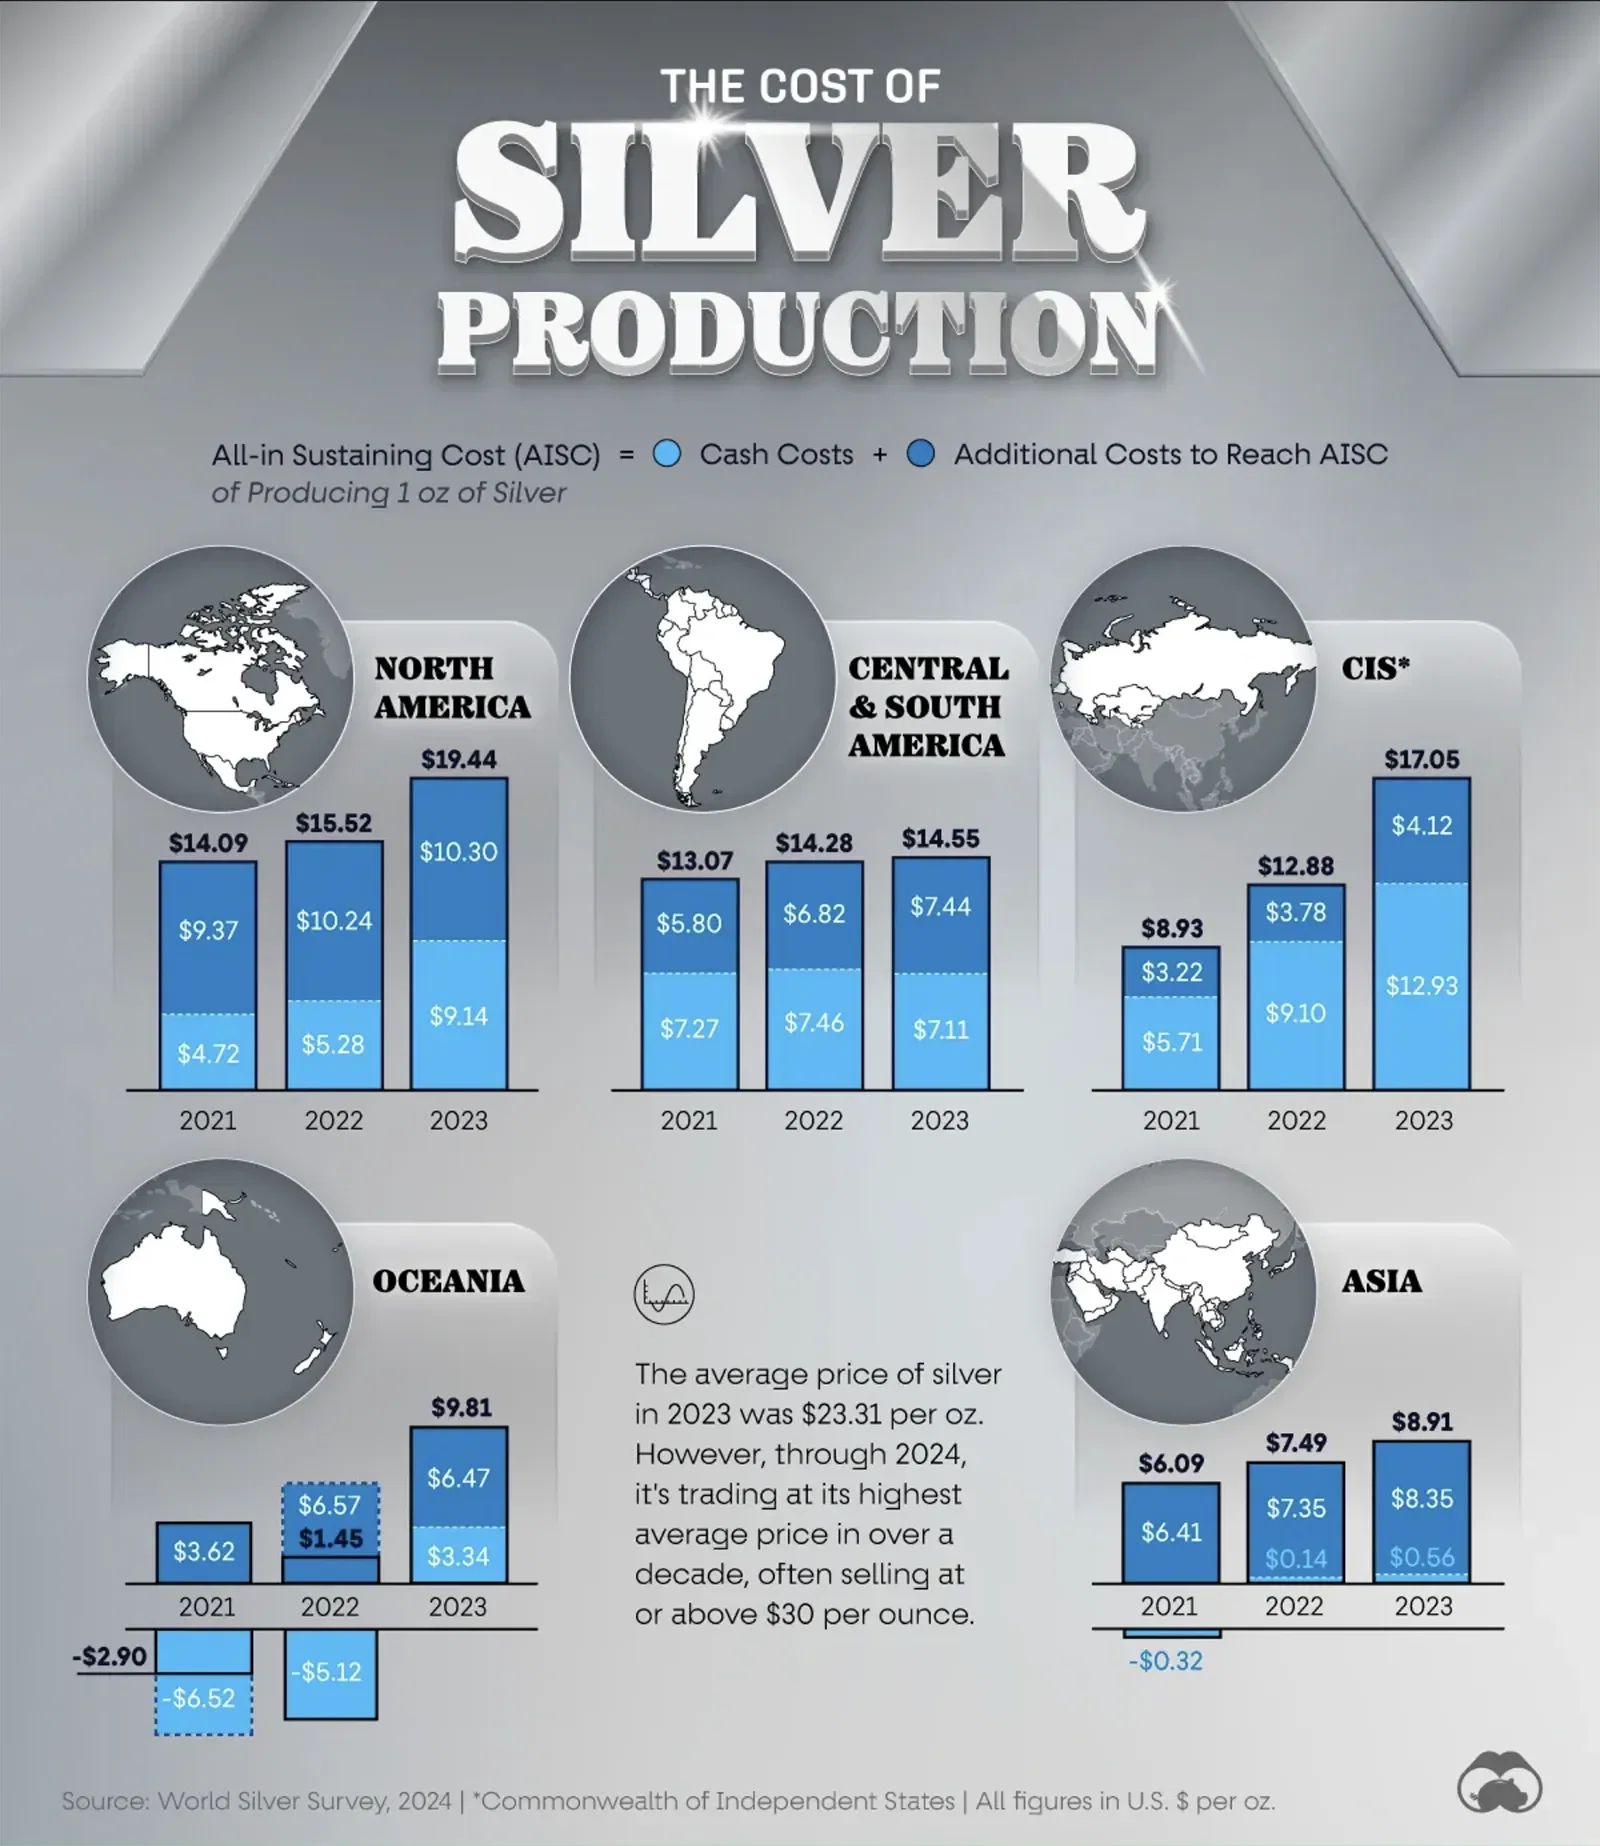
This graphic shows the increase in the costs of producing silver by region, comparing costs between 2021 and those in 2022 and 2023.
Key Takeaways
The data for this visualization was sourced from the World Silver Survey 2024, a publication by one of our data partners, The Silver Institute. Our data partnerships are commercial agreements that may or may not include compensation, and partners are not involved with our editorial or graphical processes in any capacity.