Natural ResourcesSep 5, 2024
The Rising Cost of Silver Production
What We’re Showing
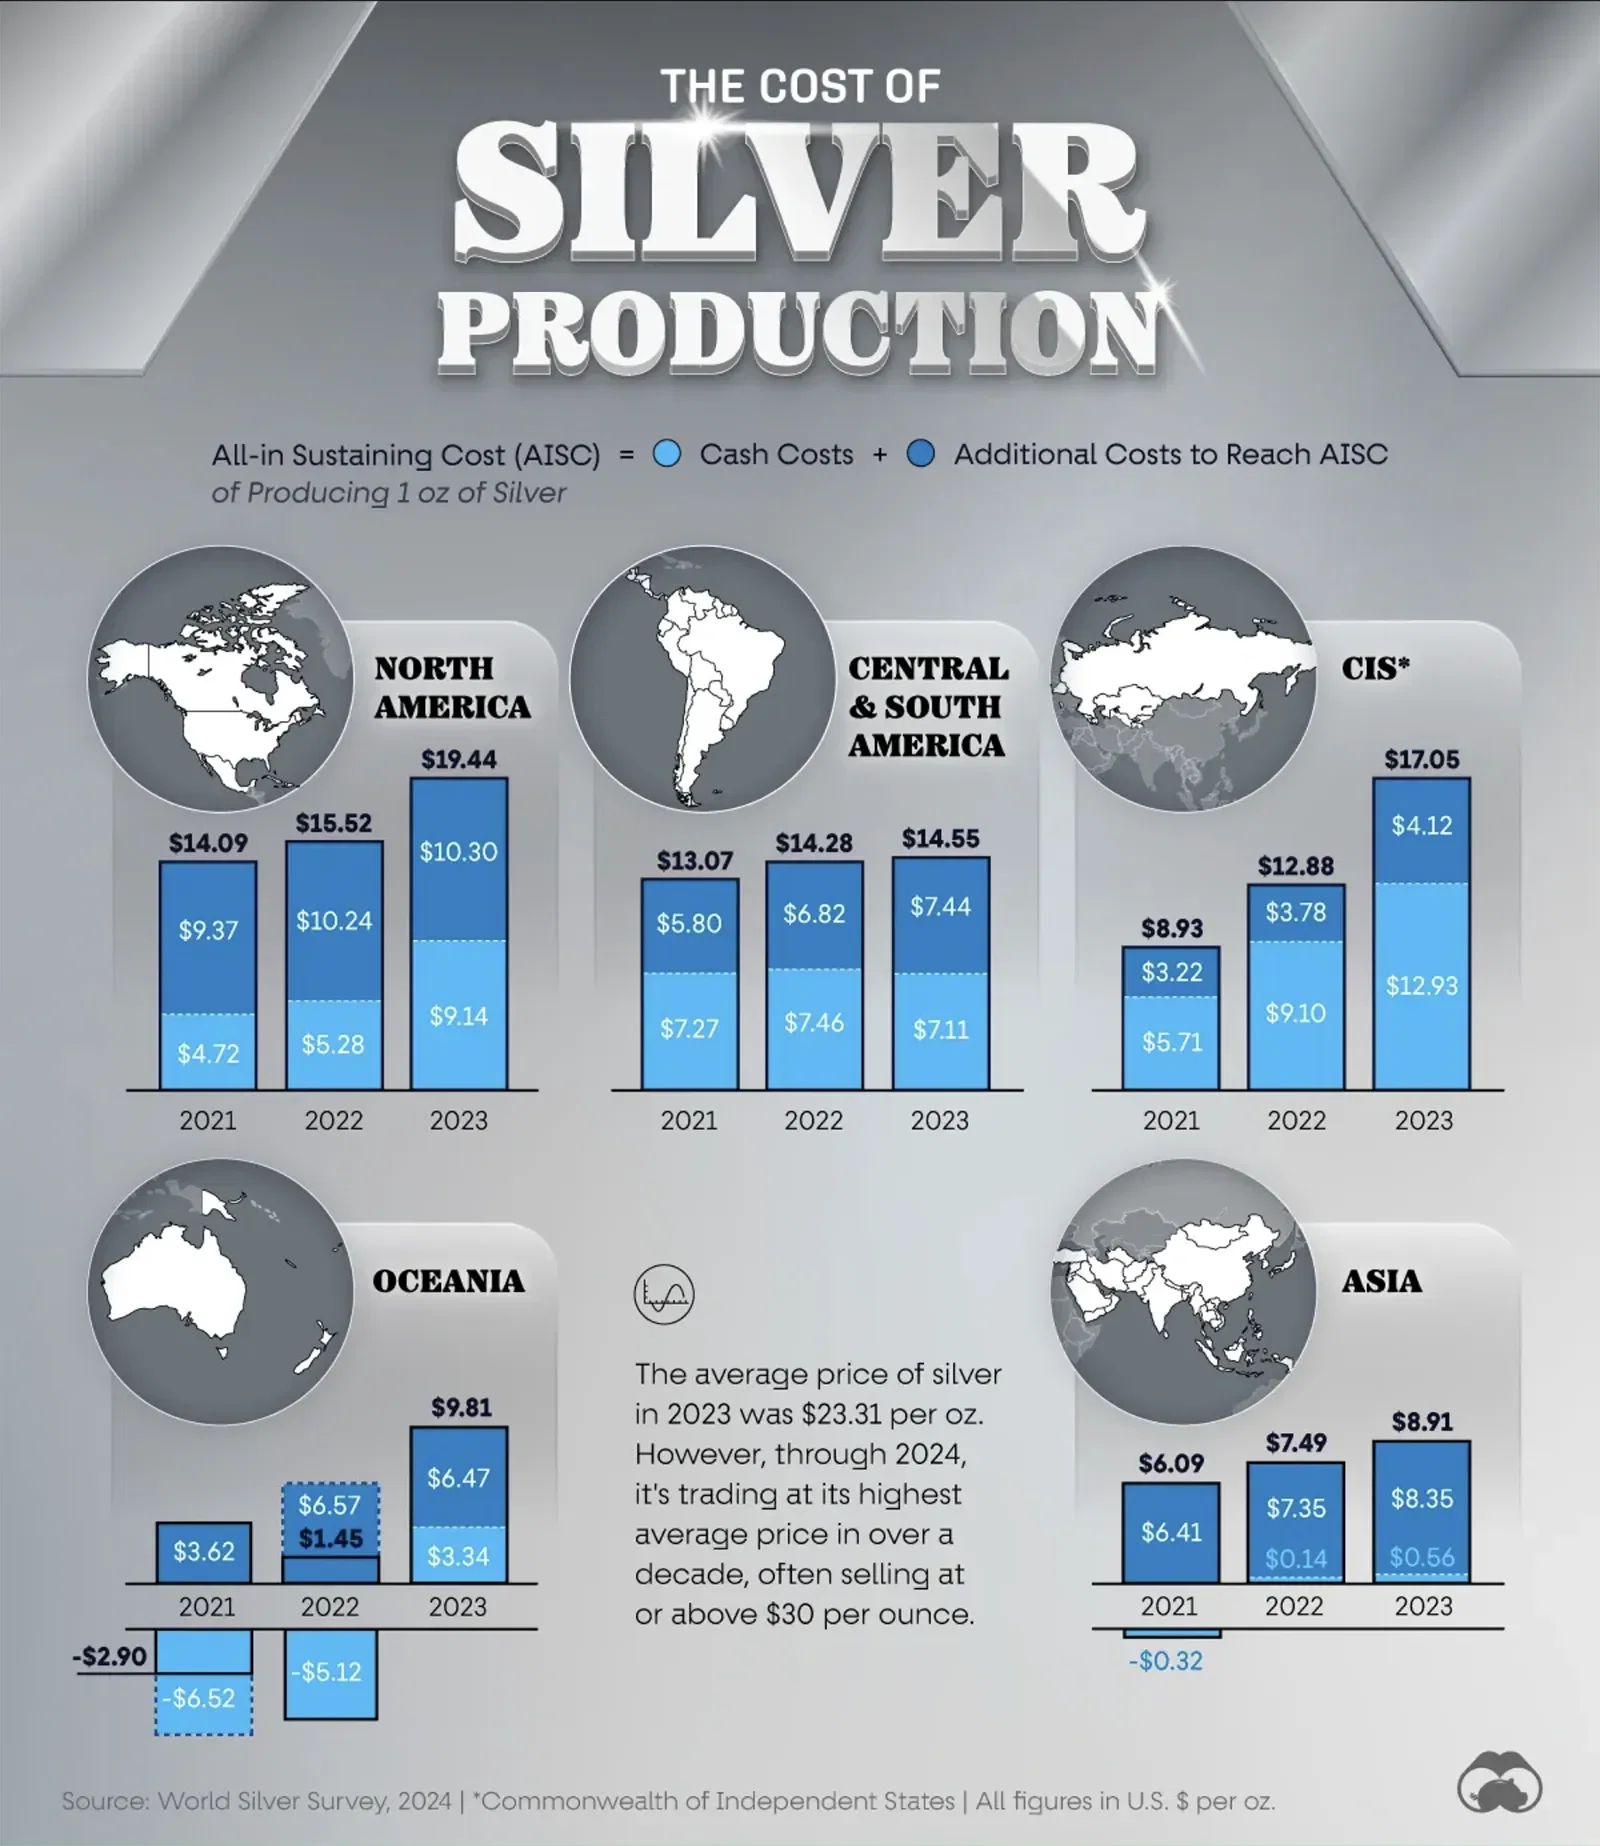
This graphic shows the increase in the costs of producing silver by region, comparing costs between 2021 and those in 2022 and 2023.
Key Takeaways
- The global cost of silver has grown significantly between 2021 and 2023
- In three years, cost increases in Asia and Oceania swung from negative to positive
The data for this visualization was sourced from the World Silver Survey 2024, a publication by one of our data partners, The Silver Institute. Our data partnerships are commercial agreements that may or may not include compensation, and partners are not involved with our editorial or graphical processes in any capacity.
Dataset
Primary Silver Production Costs, By Product (US$/oz) | |||
---|---|---|---|
Region | 2021 | 2022 | 2023 |
North America | |||
Total Cash | $4.72 | $5.28 | $9.14 |
All-In Sustaining | $14.09 | $15.52 | $19.44 |
Central & South America | |||
Total Cash | $7.27 | $7.46 | $7.11 |
All-In Sustaining | $13.07 | $14.28 | $14.55 |
CIS | |||
Total Cash | $5.71 | $9.10 | $12.93 |
All-In Sustaining | $8.93 | $12.88 | $17.05 |
Asia | |||
Total Cash | -$0.32 | $0.14 | $0.56 |
All-In Sustaining | $6.09 | $7.49 | $8.91 |
Oceania | |||
Total Cash | -$6.52 | -$5.12 | $3.34 |
All-In Sustaining | -$2.90 | $1.45 | $9.81 |
Global | |||
Total Cash | 4.23 | 5.19 | 8.38 |
All-In Sustaining | 11.67 | 13.76 | 17.18 |
Data sources
Costs are shown on a by-product accounting basis
11
0
3.0K