Where Data Tells the Story
© Voronoi 2026. All rights reserved.

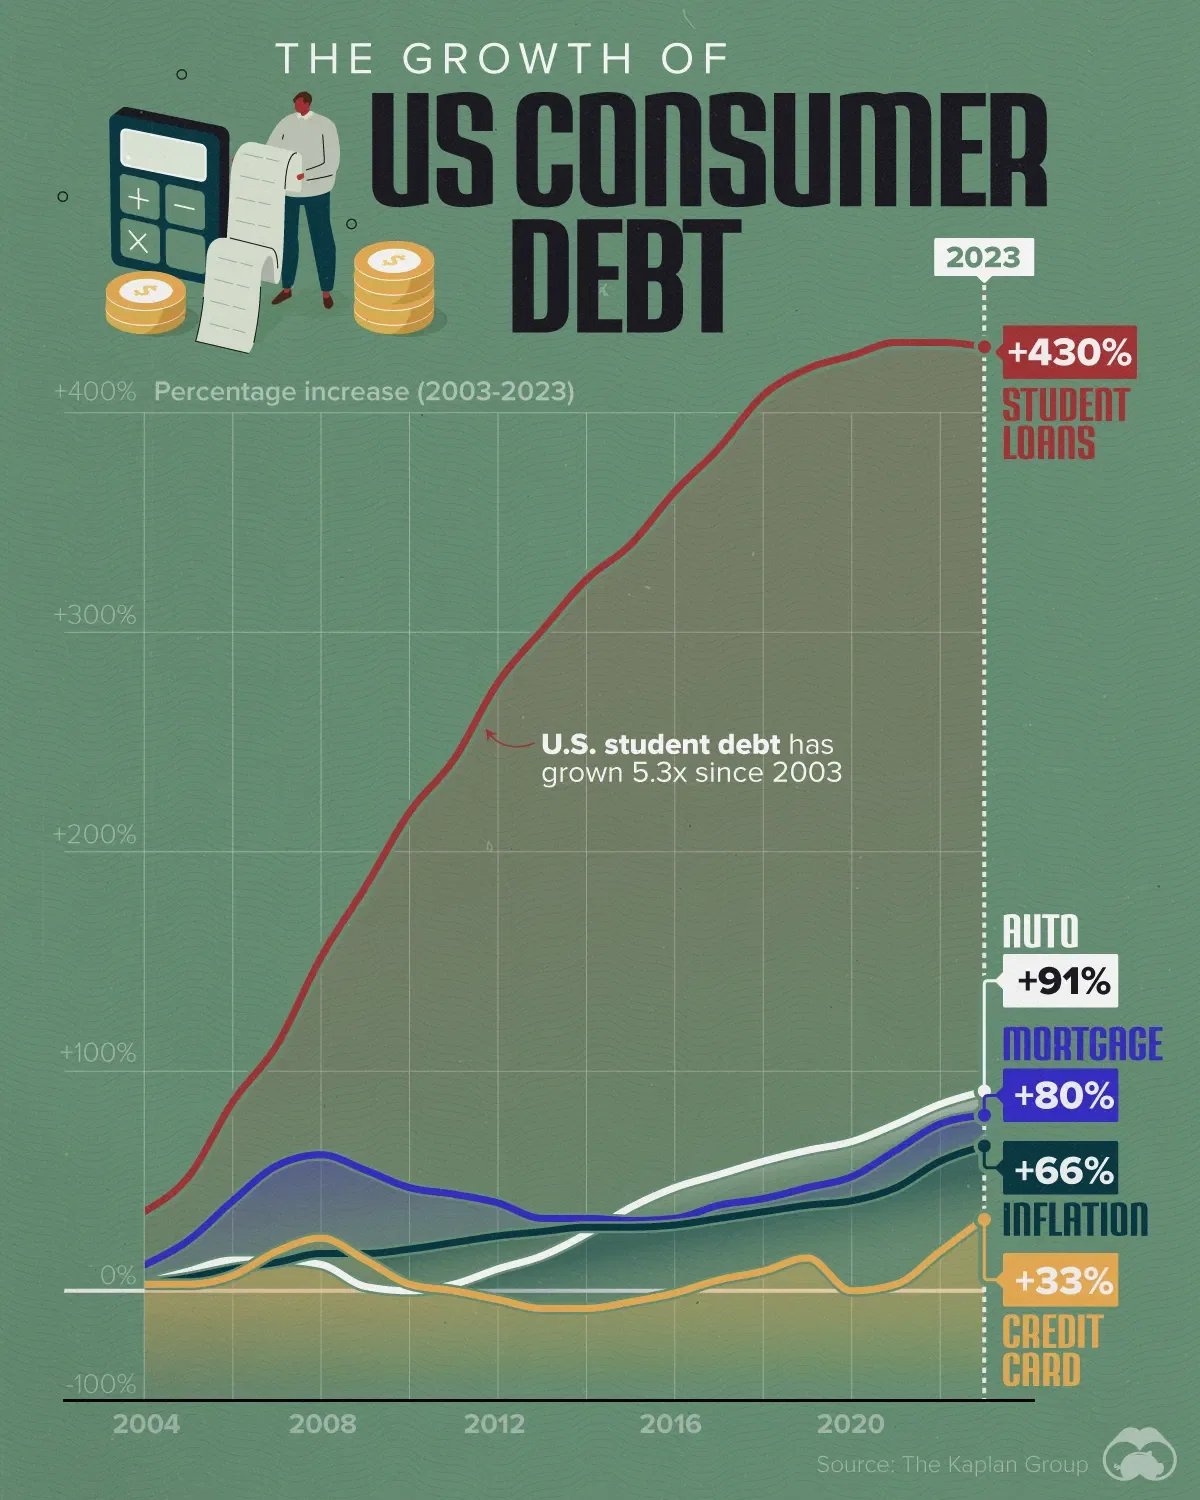
The percentage increase in U.S. household debt by category (2003-2023).
The Kaplan Group analyzed the State Level Household Debt Statistics from 2003 to 2023, sourced from the Federal Reserve Bank of New York. Data were retrieved for auto loans, mortgages, credit cards, and student loans since 2003. The evolution of each of these elements over the last 20 years was calculated. For inflation, the Consumer Price Index (CPI) was utilized.