MoneyJul 12, 2024
U.S. Workers Earning Under $17/Hour by State
What We’re Showing
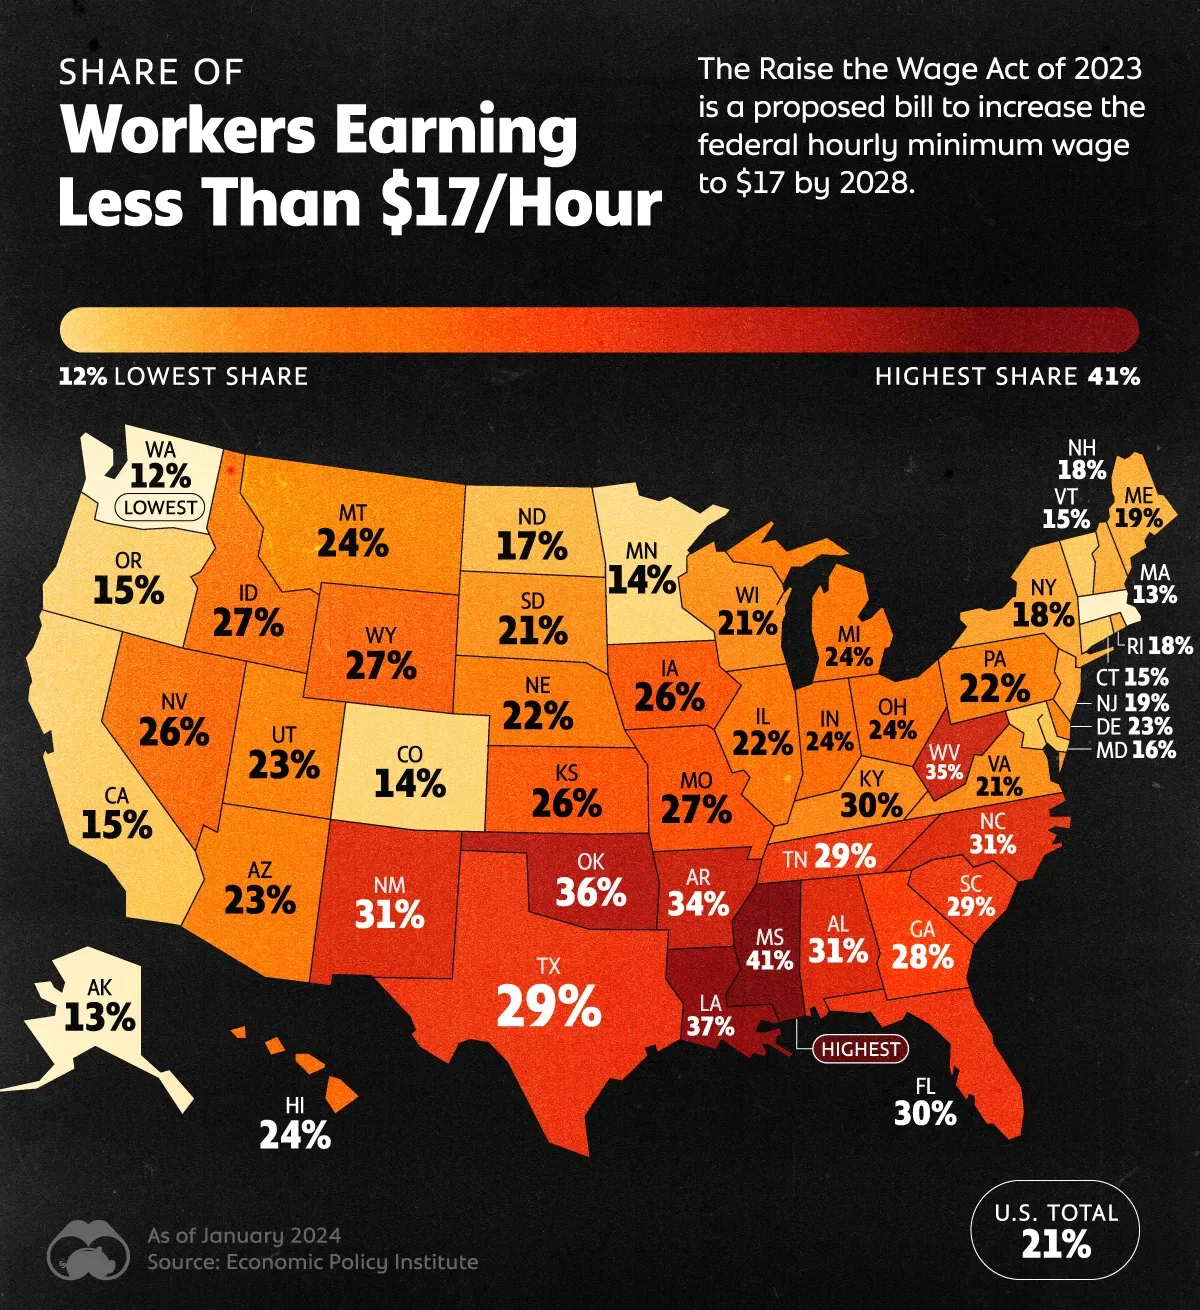
This graphic shows the share of U.S. workers earning under $17 an hour by state. Figures are as of January 2024 and data is from the Economic Policy Institute.
Key Takeaways
- The South is home to the top three states with the highest share of workers earning under $17 an hour: Mississippi (41%), Louisiana (37%), and Oklahoma (36%)
- By contrast, Washington has the lowest share, at 12% of the workforce, owing in part to its high minimum wage, which increased to $16.28 this year
- Since 2009, the federal minimum wage has remained unchanged at $7.25, but the Raise the Wage Act of 2023 is proposing to gradually lift it to $17 an hour by 2028
- Despite a lack of progress on increasing the federal minimum wage, the share of workers earning under $17 an hour across the country has declined from over 30% in 2014 to 21% in 2024, adjusted for inflation
Dataset
State | Share of workers earning <17/hour | Number of workers earning <17/hour |
---|---|---|
Alaska | 13% | 41,000 |
Alabama | 31% | 641,000 |
Arkansas | 34% | 412,000 |
Arizona | 23% | 729,000 |
California | 15% | 2,467,000 |
Colorado | 14% | 388,000 |
Connecticut | 15% | 240,000 |
District of Columbia | n/a | n/a |
Delaware | 23% | 101,000 |
Florida | 30% | 2,850,000 |
Georgia | 28% | 1,302,000 |
Hawaii | 24% | 140,000 |
Iowa | 26% | 383,000 |
Idaho | 27% | 219,000 |
Illinois | 22% | 1,197,000 |
Indiana | 24% | 735,000 |
Kansas | 26% | 354,000 |
Kentucky | 30% | 518,000 |
Louisiana | 37% | 647,000 |
Massachusetts | 13% | 414,000 |
Maryland | 16% | 445,000 |
Maine | 19% | 107,000 |
Michigan | 24% | 1,057,000 |
Minnesota | 14% | 381,000 |
Missouri | 27% | 729,000 |
Mississippi | 41% | 443,000 |
Montana | 24% | 111,000 |
North Carolina | 31% | 1,428,000 |
North Dakota | 17% | 62,000 |
Nebraska | 22% | 204,000 |
New Hampshire | 18% | 117,000 |
New Jersey | 19% | 801,000 |
New Mexico | 31% | 251,000 |
Nevada | 26% | 361,000 |
New York | 18% | 1,478,000 |
Ohio | 24% | 1,241,000 |
Oklahoma | 36% | 608,000 |
Oregon | 15% | 277,000 |
Pennsylvania | 22% | 1,285,000 |
Rhode Island | 18% | 92,000 |
South Carolina | 29% | 612,000 |
South Dakota | 21% | 89,000 |
Tennessee | 29% | 853,000 |
Texas | 29% | 3,824,000 |
Utah | 23% | 366,000 |
Virginia | 21% | 843,000 |
Vermont | 15% | 45,000 |
Washington | 12% | 411,000 |
Wisconsin | 21% | 584,000 |
West Virginia | 35% | 238,000 |
Wyoming | 27% | 70,000 |
U.S. Total | 21% | 30,600,000 |
Data sources
27
0
36.9K