MoneyAug 30, 2024
Ranked: A Decade of Major Currency Returns 💰
Currency trading can be complex. OANDA's FREE trading guide can help.
Download NowWhat We're Showing
Annual returns of eight major currencies over the last decade (2014-2023). The data is from OANDA.
Key Takeaways
- Monetary policy, geopolitical events, and economic conditions all played a role in determining currency returns throughout the last 10 years.
- The U.S. dollar was the best-performing currency, taking the top spot in five of the last ten years.
- Ultra-low interest rates in Japan have caused the Yen to struggle, earning a negative return in 5 of the last 10 years.
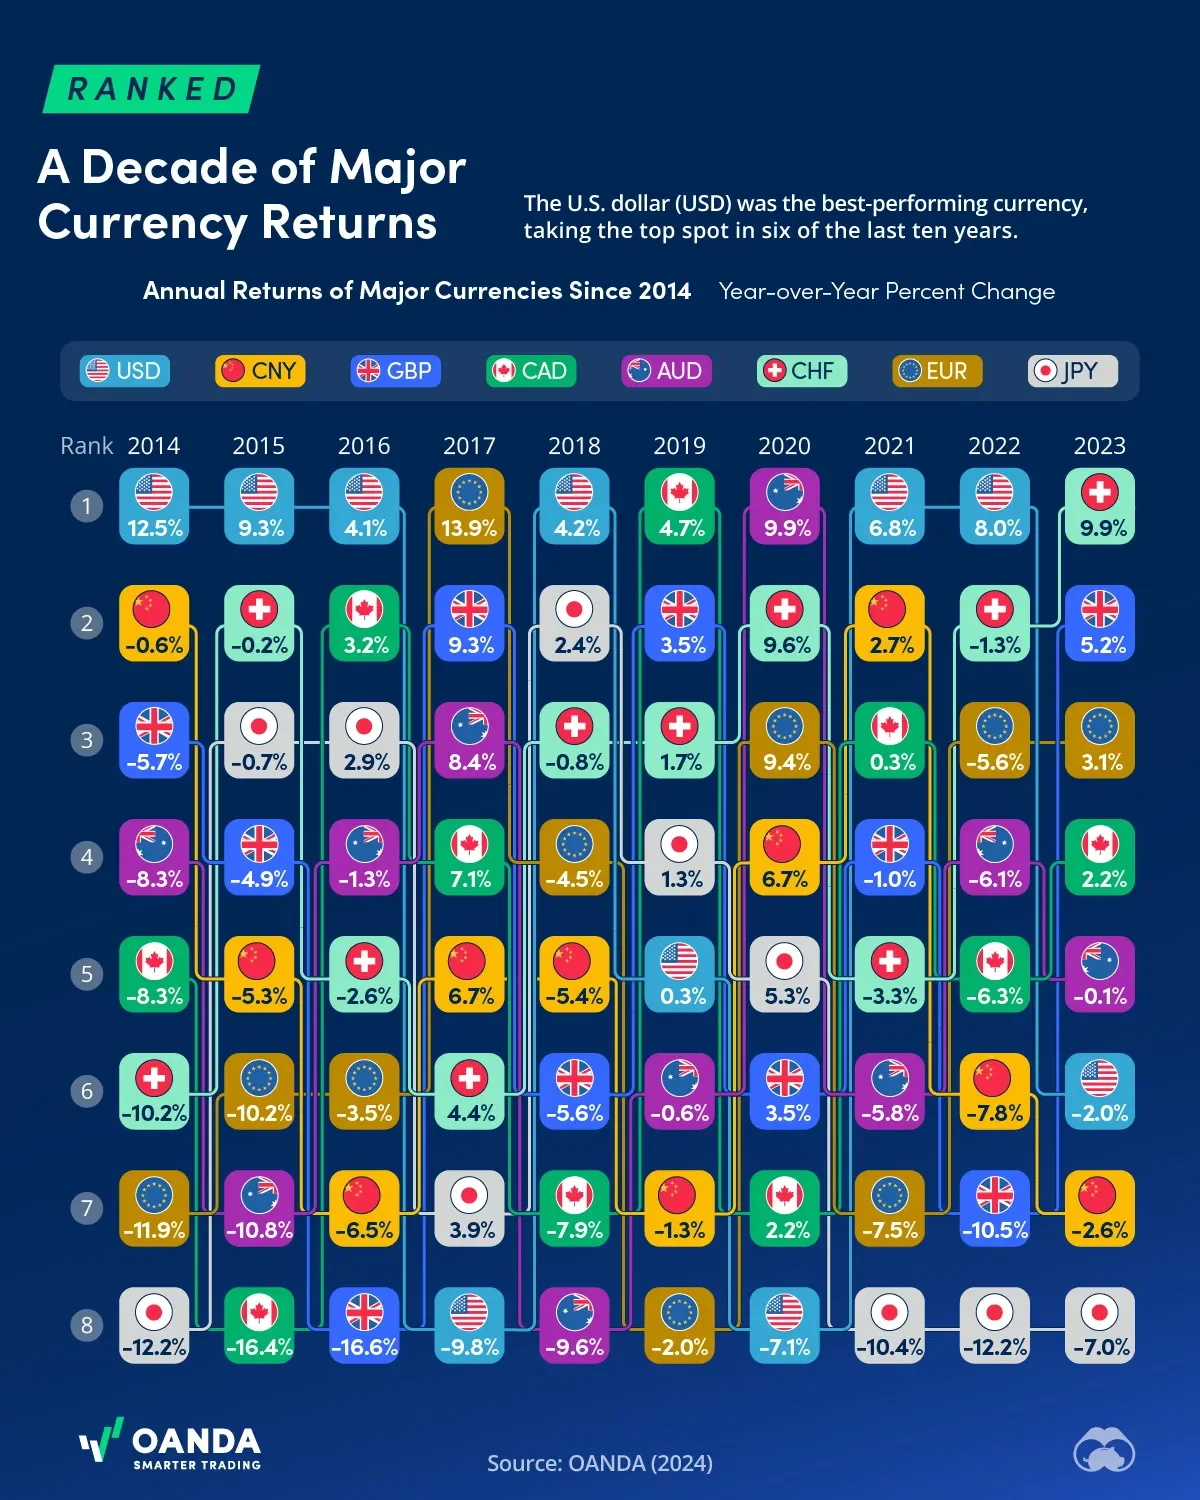
Dataset
Year | USD | CAD | CHF | EUR | GBP | JPY | SEK | AUD | CNY |
---|---|---|---|---|---|---|---|---|---|
2014 | 12.5% | -8.3% | -10.2% | -11.9% | -5.7% | -12.2% | -17.2% | -8.3% | -0.6% |
2015 | 9.3% | -16.4% | -0.2% | -10.2% | -4.9% | -0.7% | -7.9% | -10.8% | -5.3% |
2016 | 4.1% | 3.2% | -2.6% | -3.5% | -16.6% | 2.9% | -7.5% | -1.3% | -6.5% |
2017 | -9.8% | 7.1% | 4.4% | 13.9% | 9.3% | 3.9% | 10.9% | 8.4% | 6.7% |
2018 | 4.2% | -7.9% | -0.8% | -4.5% | -5.6% | 2.4% | -8.0% | -9.6% | -5.4% |
2019 | 0.3% | 4.7% | 1.7% | -2.0% | 3.5% | 1.3% | -4.4% | -0.6% | -1.3% |
2020 | -7.1% | 2.2% | 9.6% | 9.4% | 3.5% | 5.3% | 13.9% | 9.9% | 6.7% |
2021 | 6.8% | 0.3% | -3.3% | -7.5% | -1.0% | -10.4% | -9.4% | -5.8% | 2.7% |
2022 | 8.0% | -6.3% | -1.3% | -5.6% | -10.5% | -12.2% | -13.2% | -6.1% | -7.8% |
2023 | -2.0% | 2.2% | 9.9% | 3.1% | 5.2% | -7.0% | 3.4% | -0.1% | -2.6% |
Data sources
Note: Currency performance measured using non-USD/USD forex pair. Year-over-year percent changes were calculated using average mid-point data for December 31st. The USD was calculated using OANDA’S data of the following currencies and weights, as per ICE’s U.S. Dollar Index estimates: euro (57.6%), Japanese yen (13.6%), pound sterling (11.9%), Canadian dollar (9.1%), Swedish krona (4.2%), and Swiss franc (3.6%).
44
0
10.8K