Where Data Tells the Story
© Voronoi 2026. All rights reserved.

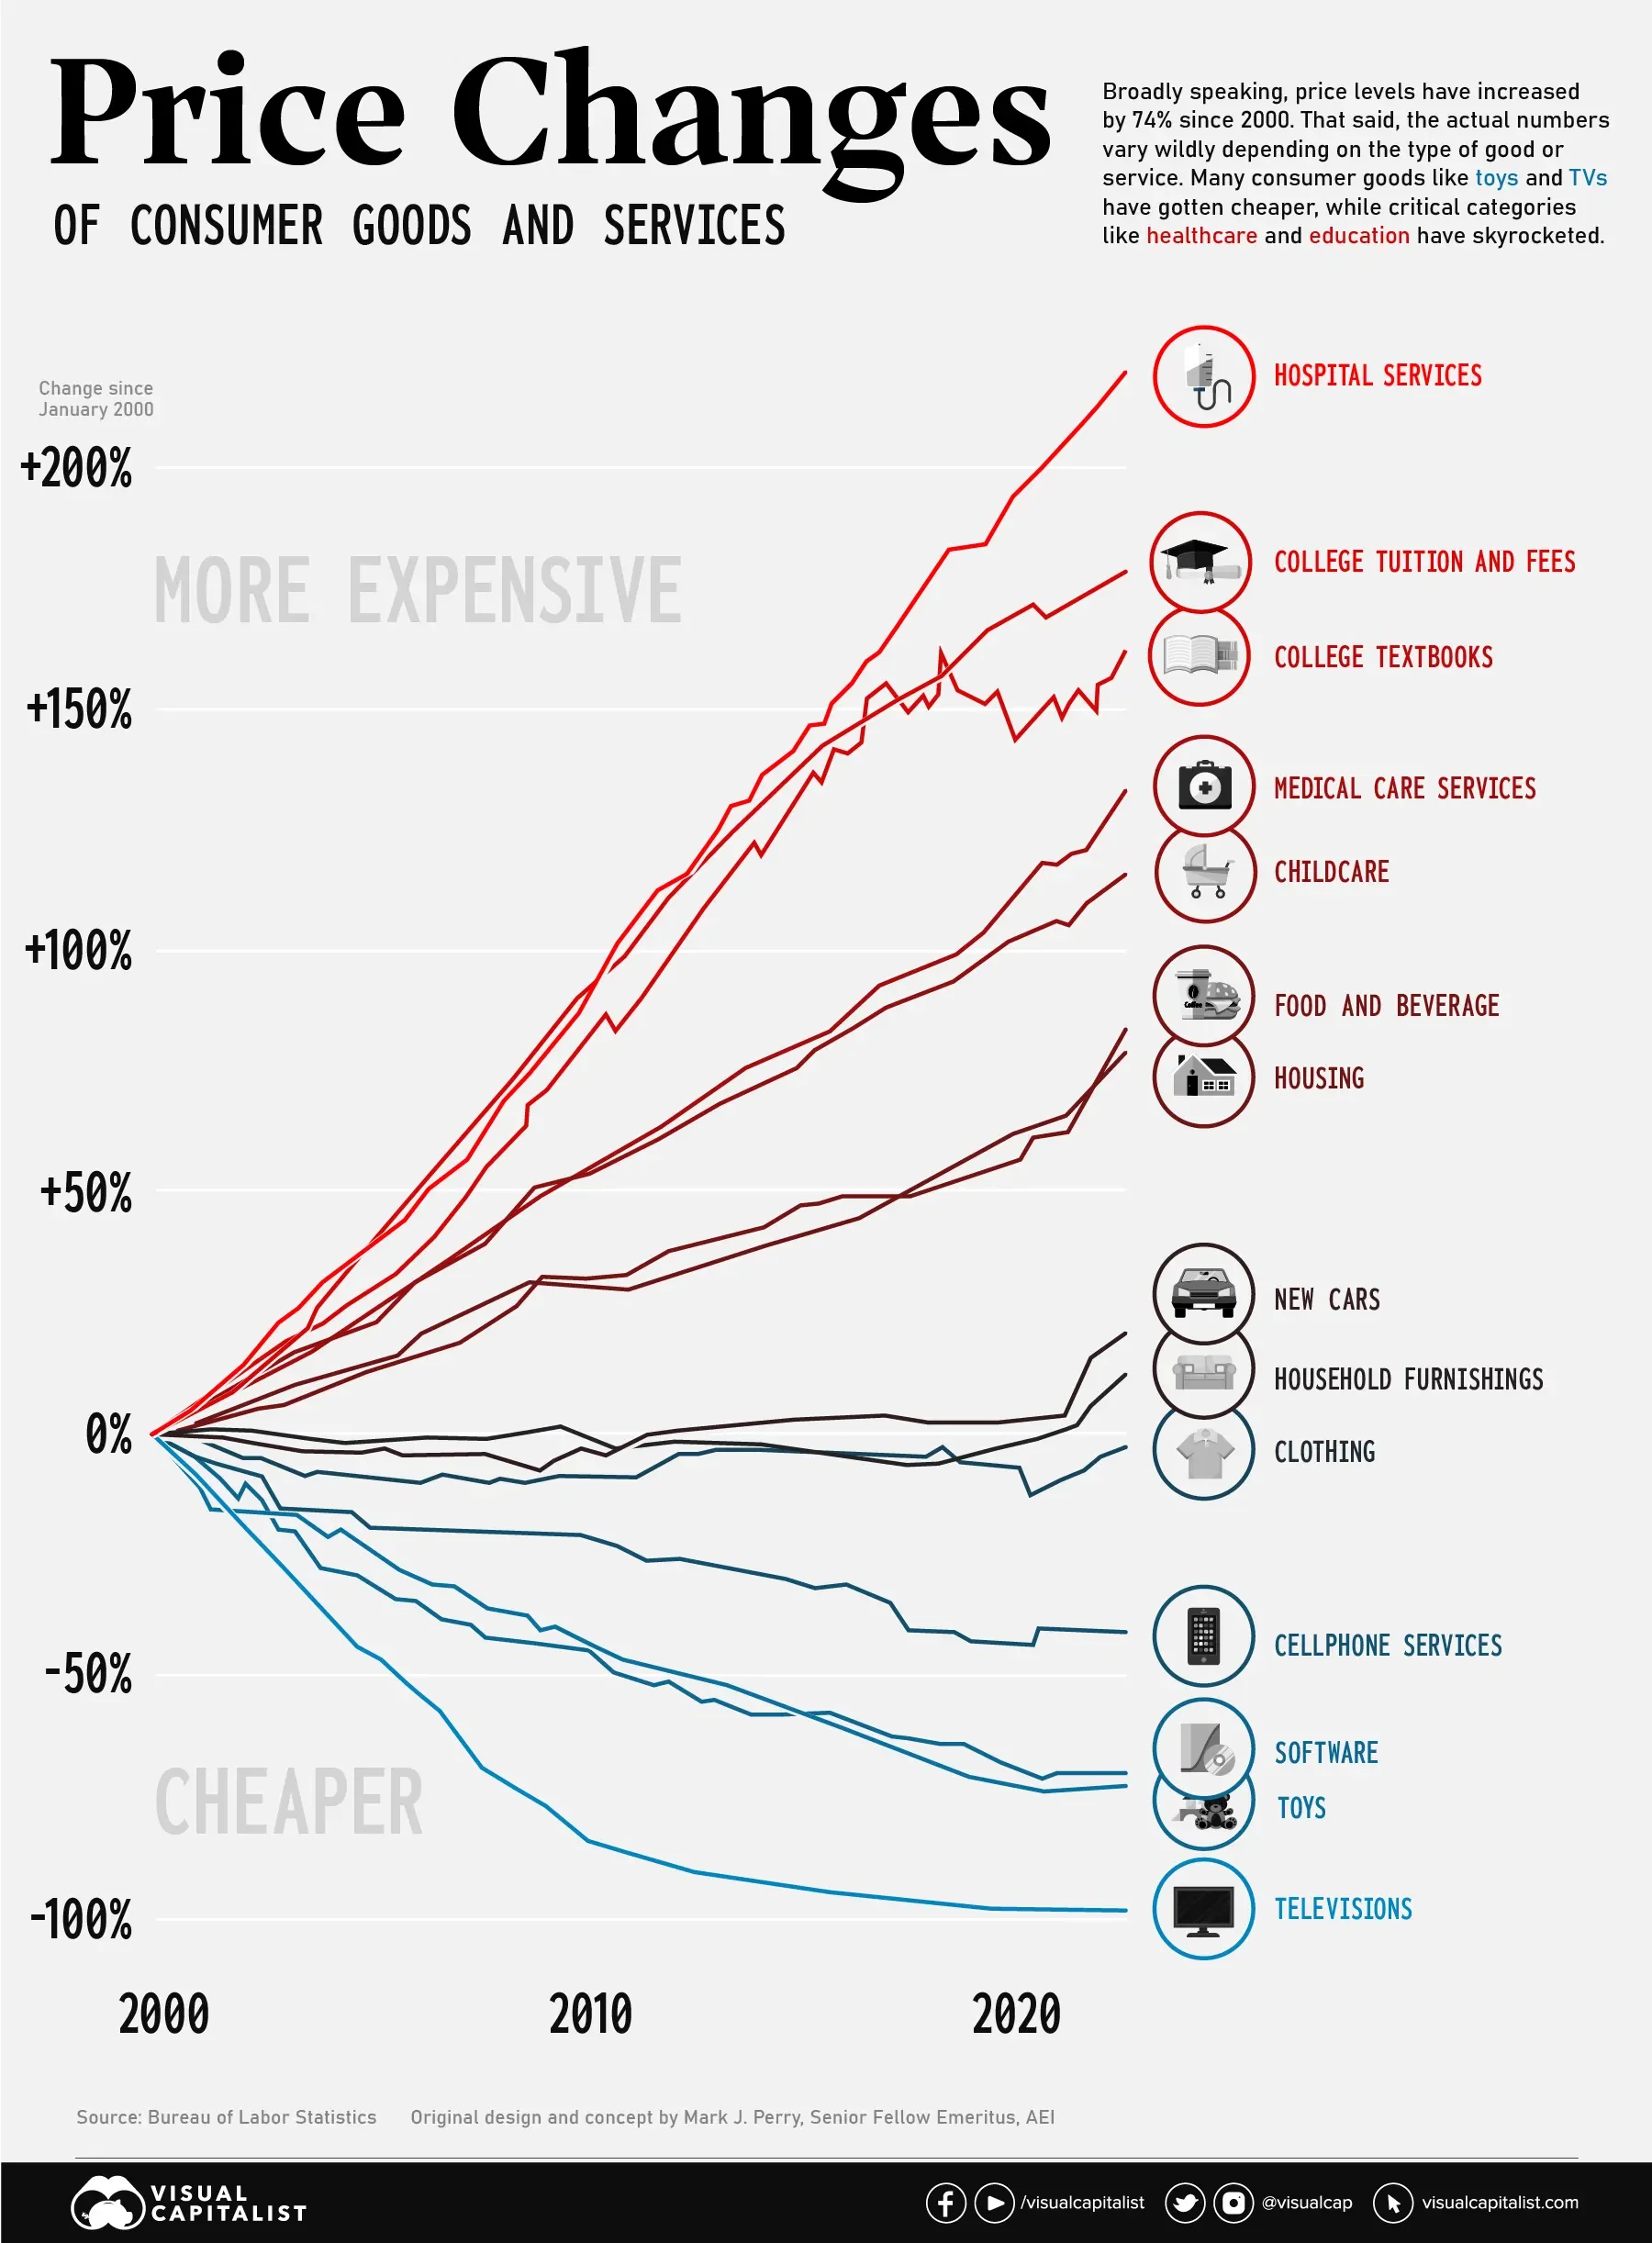
The Consumer Price Index (CPI) provides a steady indication of how inflation is affecting the economy. This big picture number is useful for policymakers and professionals in the financial sector, but most people experience inflation at the cash register or checkout screen.
Since the start of the 21st century, U.S. consumers have seen a divergence of price movements across various categories. Nowhere is this better illustrated than on this chart concept thought up by AEI’s Mark J. Perry. It’s sometimes referred to as the “chart of the century” because it provides such a clear and impactful jump-off point to discuss a number of economic forces.
The punchline is that many consumer goods—particularly those that were easily outsourced—saw price drops, while key “non-tradable” categories saw massive increases.