
Where Data Tells the Story
© Voronoi 2026. All rights reserved.

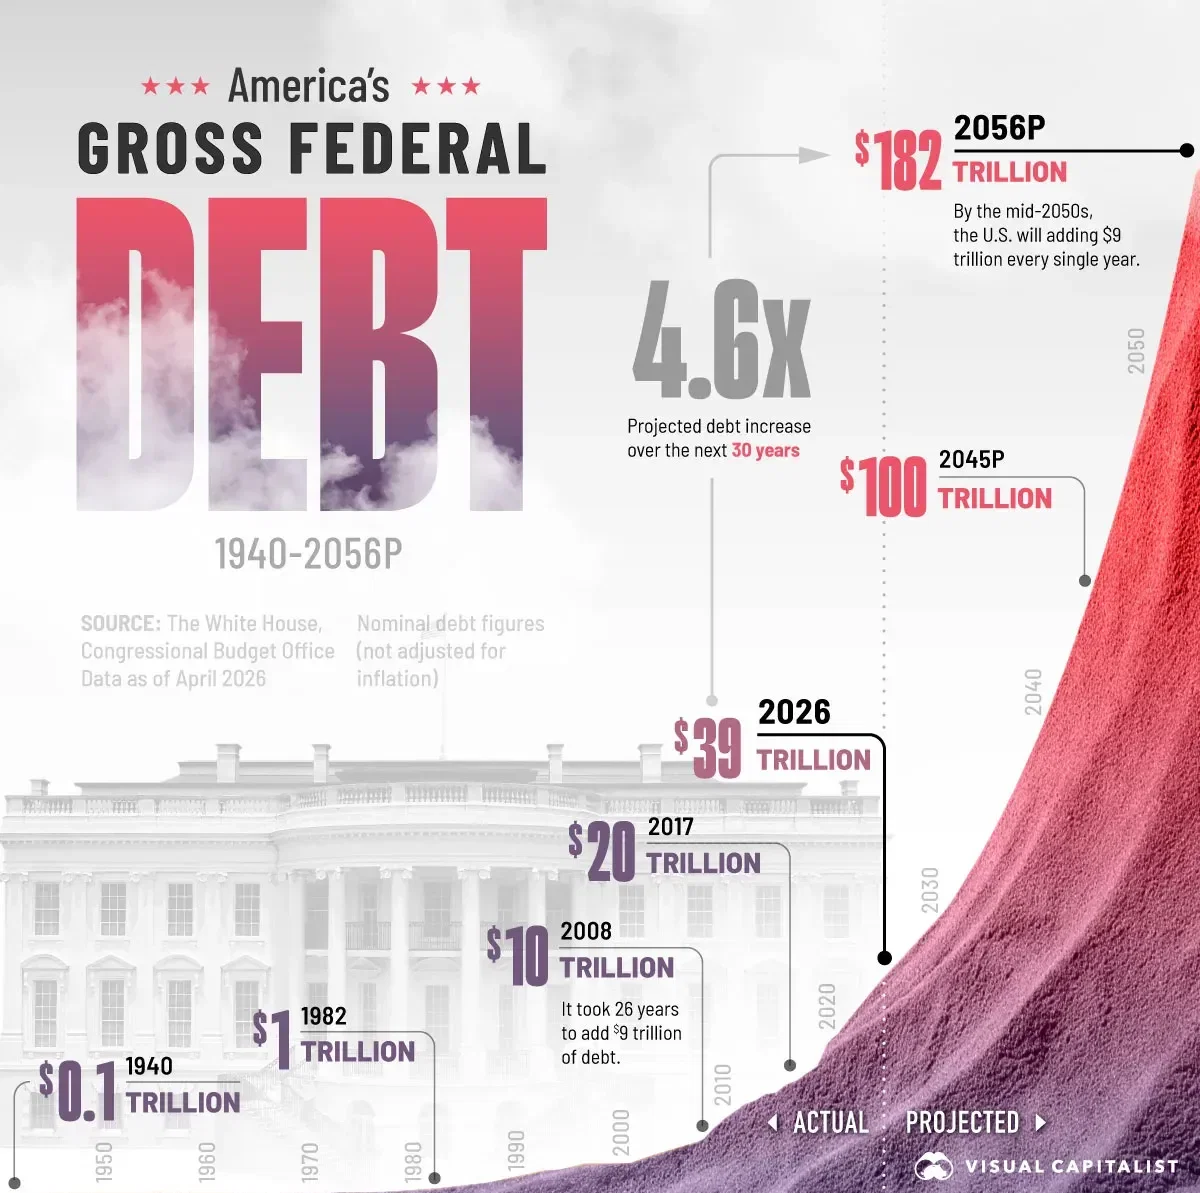
For decades, U.S. federal debt grew in long, gradual cycles. That pace is now accelerating rapidly.
This chart shows how debt expanded from $51 billion in 1940 to nearly $40 trillion today, and how it could climb to $182 trillion by 2056. At that point, the U.S. may be adding $10 trillion in debt every one to two years.
The data comes from the Congressional Budget Office (CBO) and the White House as of March 2026. Data is in nominal dollars.
Read the full article here.