
Where Data Tells the Story
© Voronoi 2026. All rights reserved.

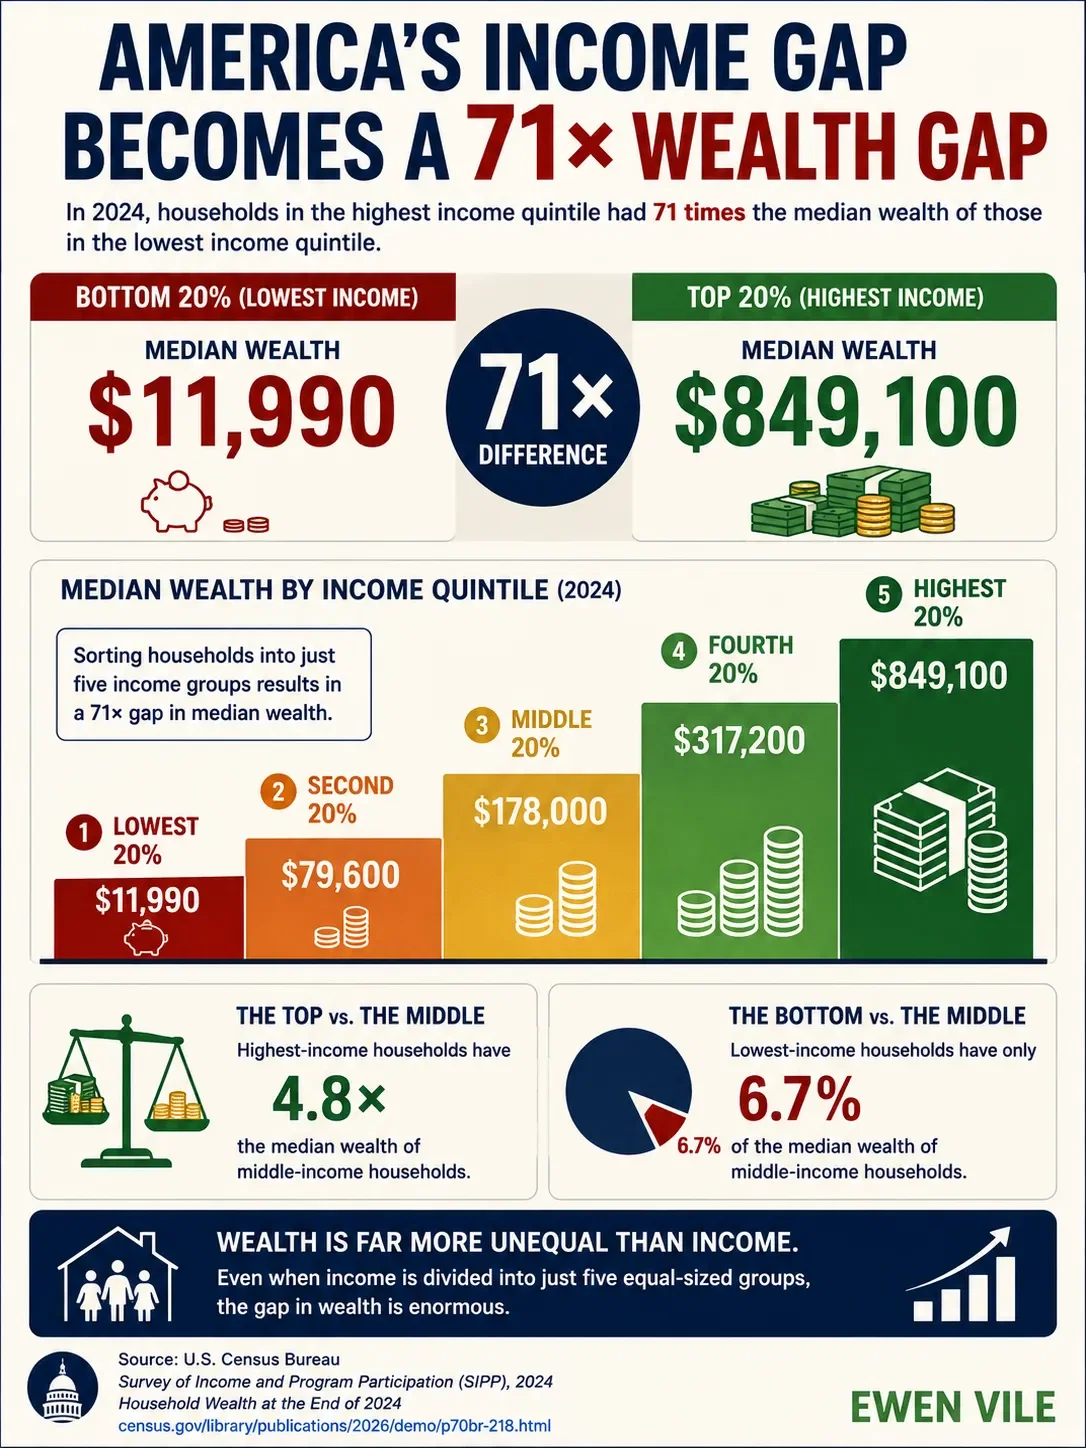
In 2024, households in the highest income quintile had median wealth of $849,100. Households in the lowest income quintile had median wealth of $11,990 — a 70.8× difference.
Household wealth rises dramatically across U.S. income groups. According to the U.S. Census Bureau’s 2025 Survey of Income and Program Participation, median household wealth at the end of 2024 was $11,990 for households in the lowest income quintile and $849,100 for households in the highest income quintile.

That makes the highest-quintile median about 70.8 times the lowest-quintile median.

The five income groups show a steep wealth staircase:
Lowest quintile: $11,990
Second quintile: $79,600
Third quintile: $178,000
Fourth quintile: $317,200
Highest quintile: $849,100

Census also reports that the lowest quintile’s median wealth was 6.7% of the middle quintile’s median, while the middle quintile’s median wealth was 21.0% of the highest quintile’s median.

KEY METRICS
Top 20% median wealth: $849,100
Bottom 20% median wealth: $11,990
Top-to-bottom ratio: 70.8×
Middle quintile median wealth: $178,000
Top-to-middle ratio: 4.8×
Bottom as share of middle: 6.7%

INCOME QUINTILE DEFINITIONS
Lowest quintile: household income at or below $33,468
Middle quintile: household income between $63,111 and $102,104
Highest quintile: household income above $169,068

IMPORTANT CAVEAT
This is a descriptive comparison of wealth across income quintiles. It does not establish that income alone causes the wealth gap. Age, homeownership, saving, investment returns, inheritance, education, household structure, debt, and prior wealth also differ across households.