Where Data Tells the Story
© Voronoi 2025. All rights reserved.

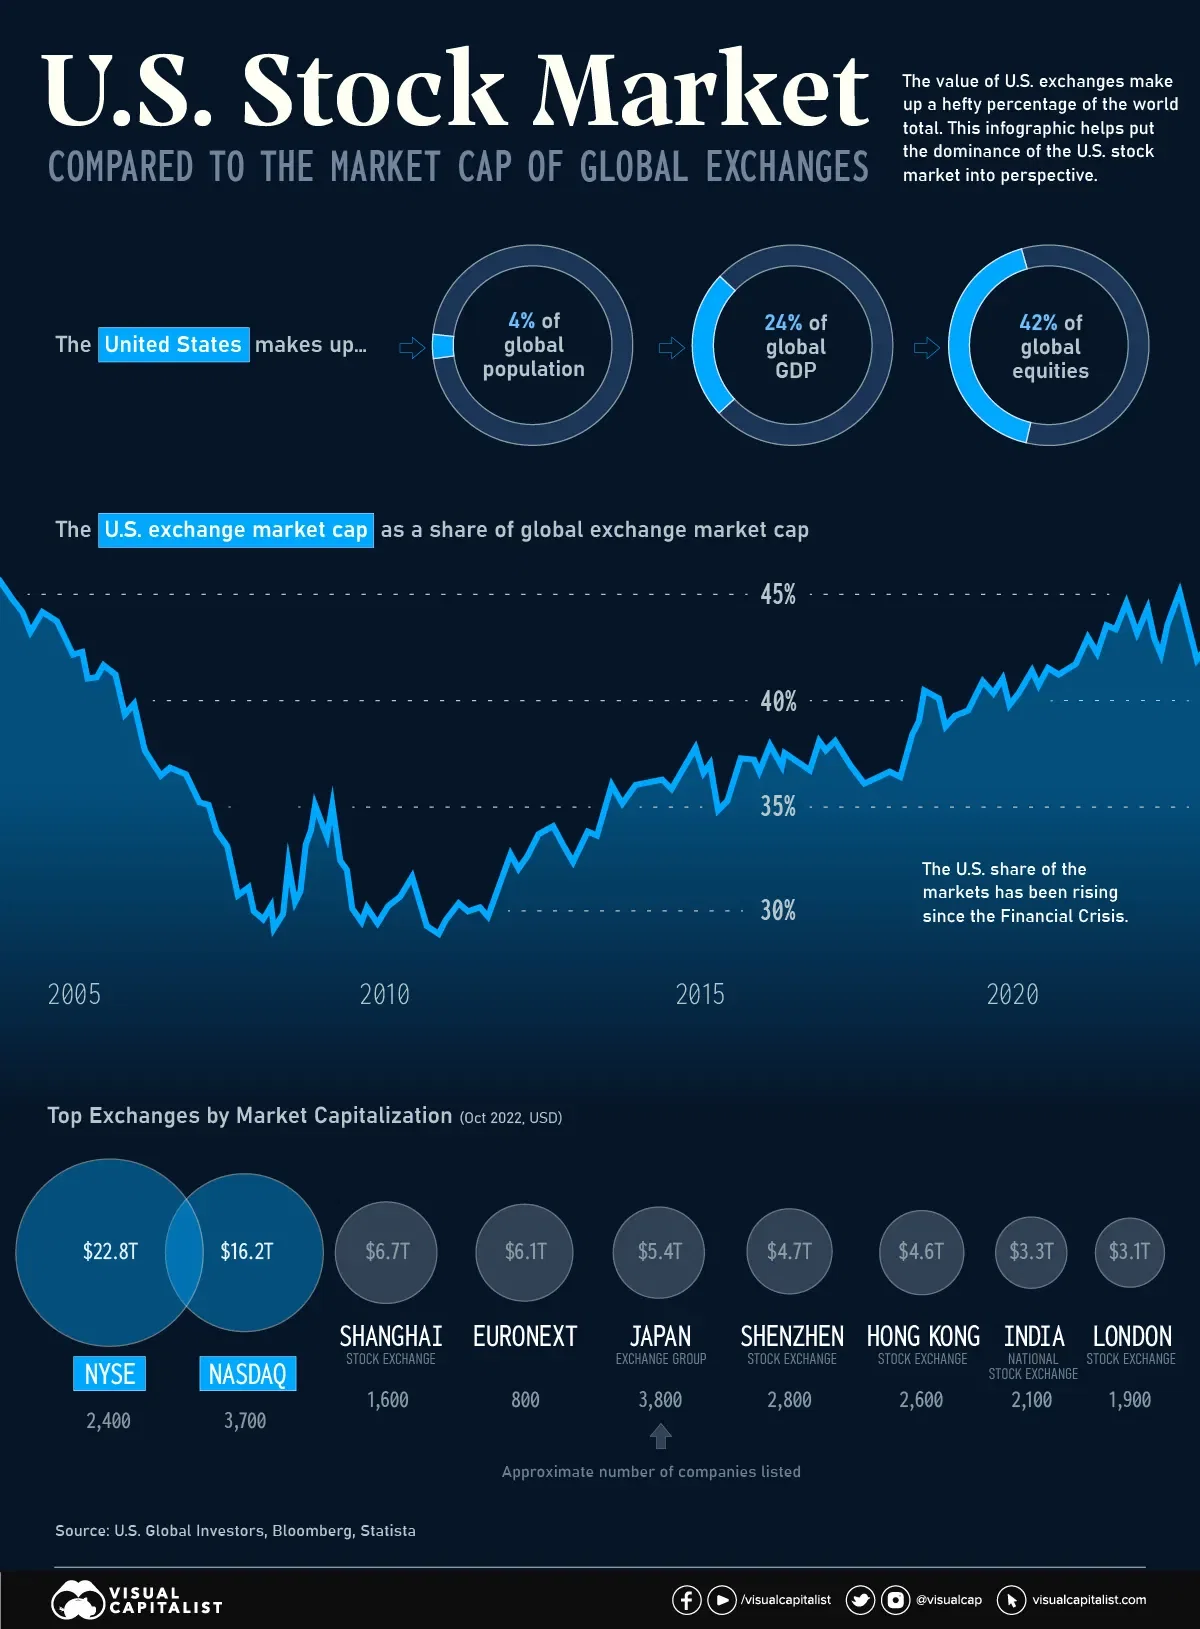
One of the most potent symbols of American financial dominance is the combined market capitalization of the country’s two biggest stock exchanges—the New York Stock Exchange (NYSE) and NASDAQ. These two major listing hubs dwarf all other exchanges around the world. In fact, the NYSE on its own is larger than the Shanghai, Shenzhen, Japan, and Euronext exchanges put together.
One of the key reasons for this dominance is the sheer size of the U.S. economy. With a GDP of over $25 trillion, the U.S. economy is the largest in the world, and American exchanges are home to some of the world’s largest and most valuable companies, including tech giants like Apple, Amazon, and Microsoft.
As of January 2023, the value of stocks listed on U.S. exchanges made up 42% of the global total. How does this total stack up, historically?
The U.S. Share Over Time
For much of the 1970s, the U.S. made up more than half of global stock market value. Over the course of the 1980s, the U.S. share of the global total began to dip, driven in part by the asset price bubble in Japan. More recently, the U.S. slice of the equities pie bottomed out temporarily around the time of the Financial Crisis, but has been steadily rising ever since.