Where Data Tells the Story
© Voronoi 2026. All rights reserved.
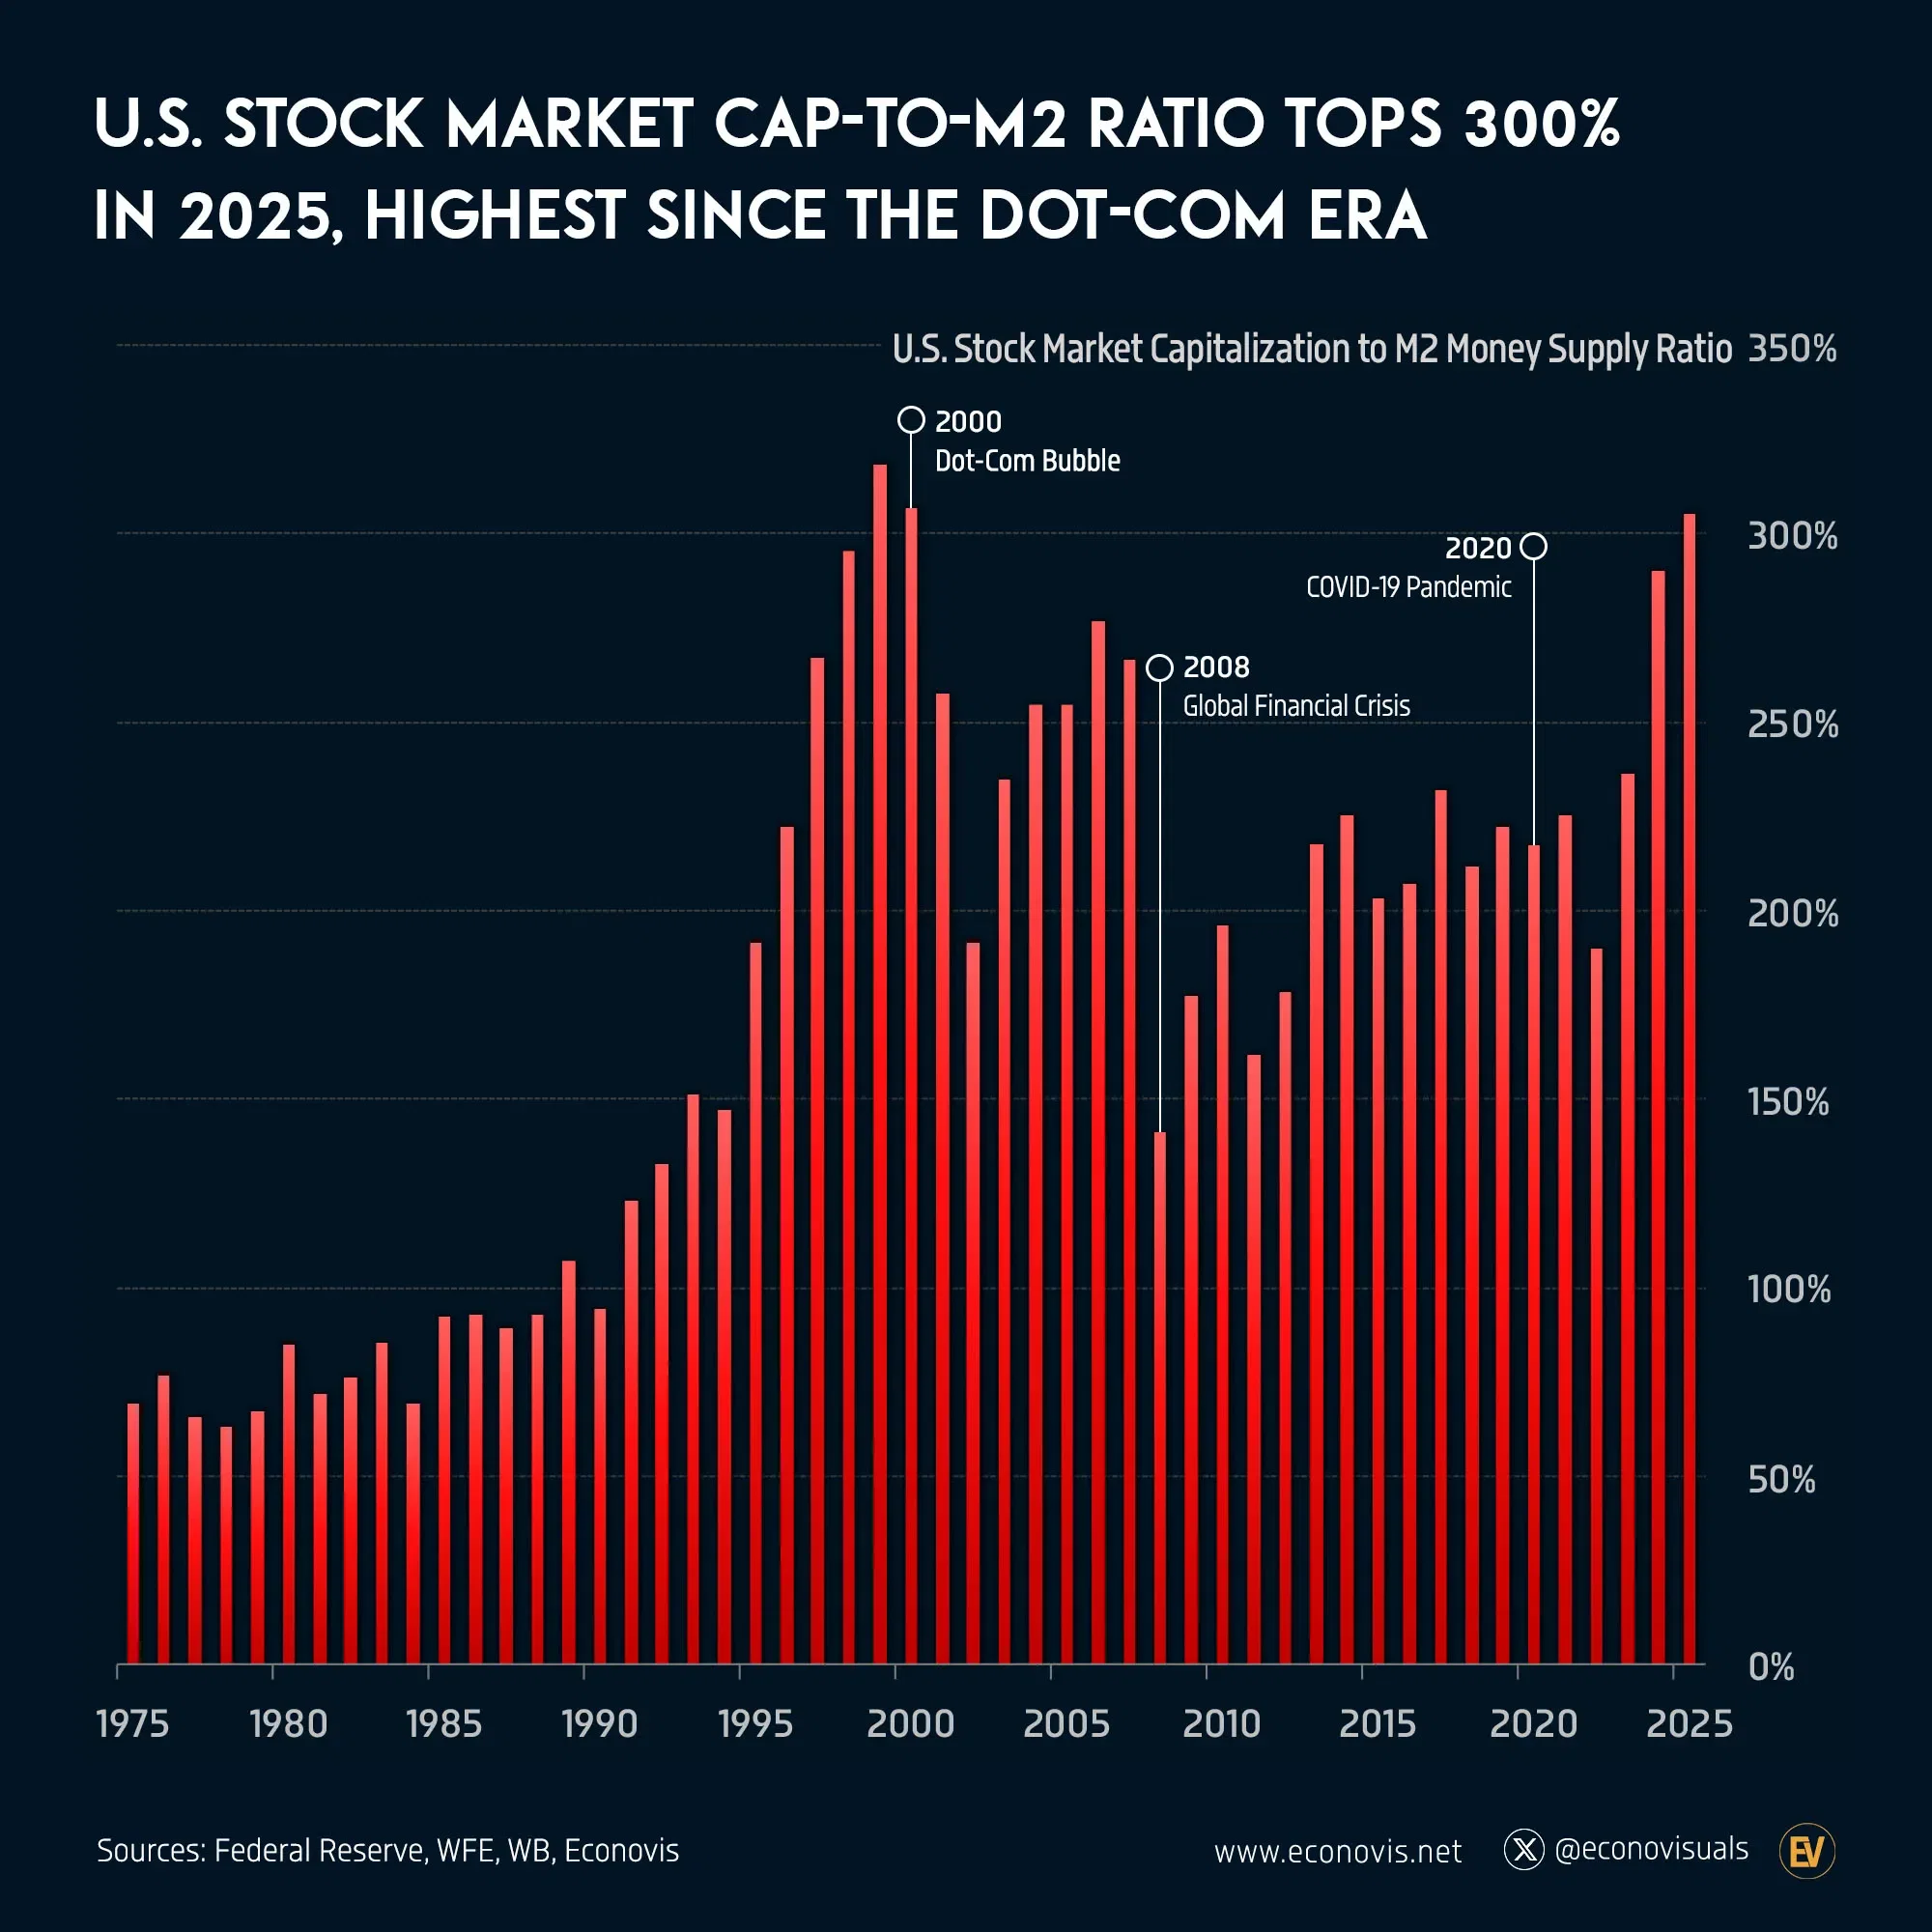
In 2025, U.S. stock market capitalization rose to 305% of the M2 money supply—the highest level since the Dot-Com Bubble. The elevated ratio highlights the outsized role of equities in absorbing available liquidity, signaling strong investor demand but also raising concerns over potential economic and financial imbalances.