Where Data Tells the Story
© Voronoi 2026. All rights reserved.

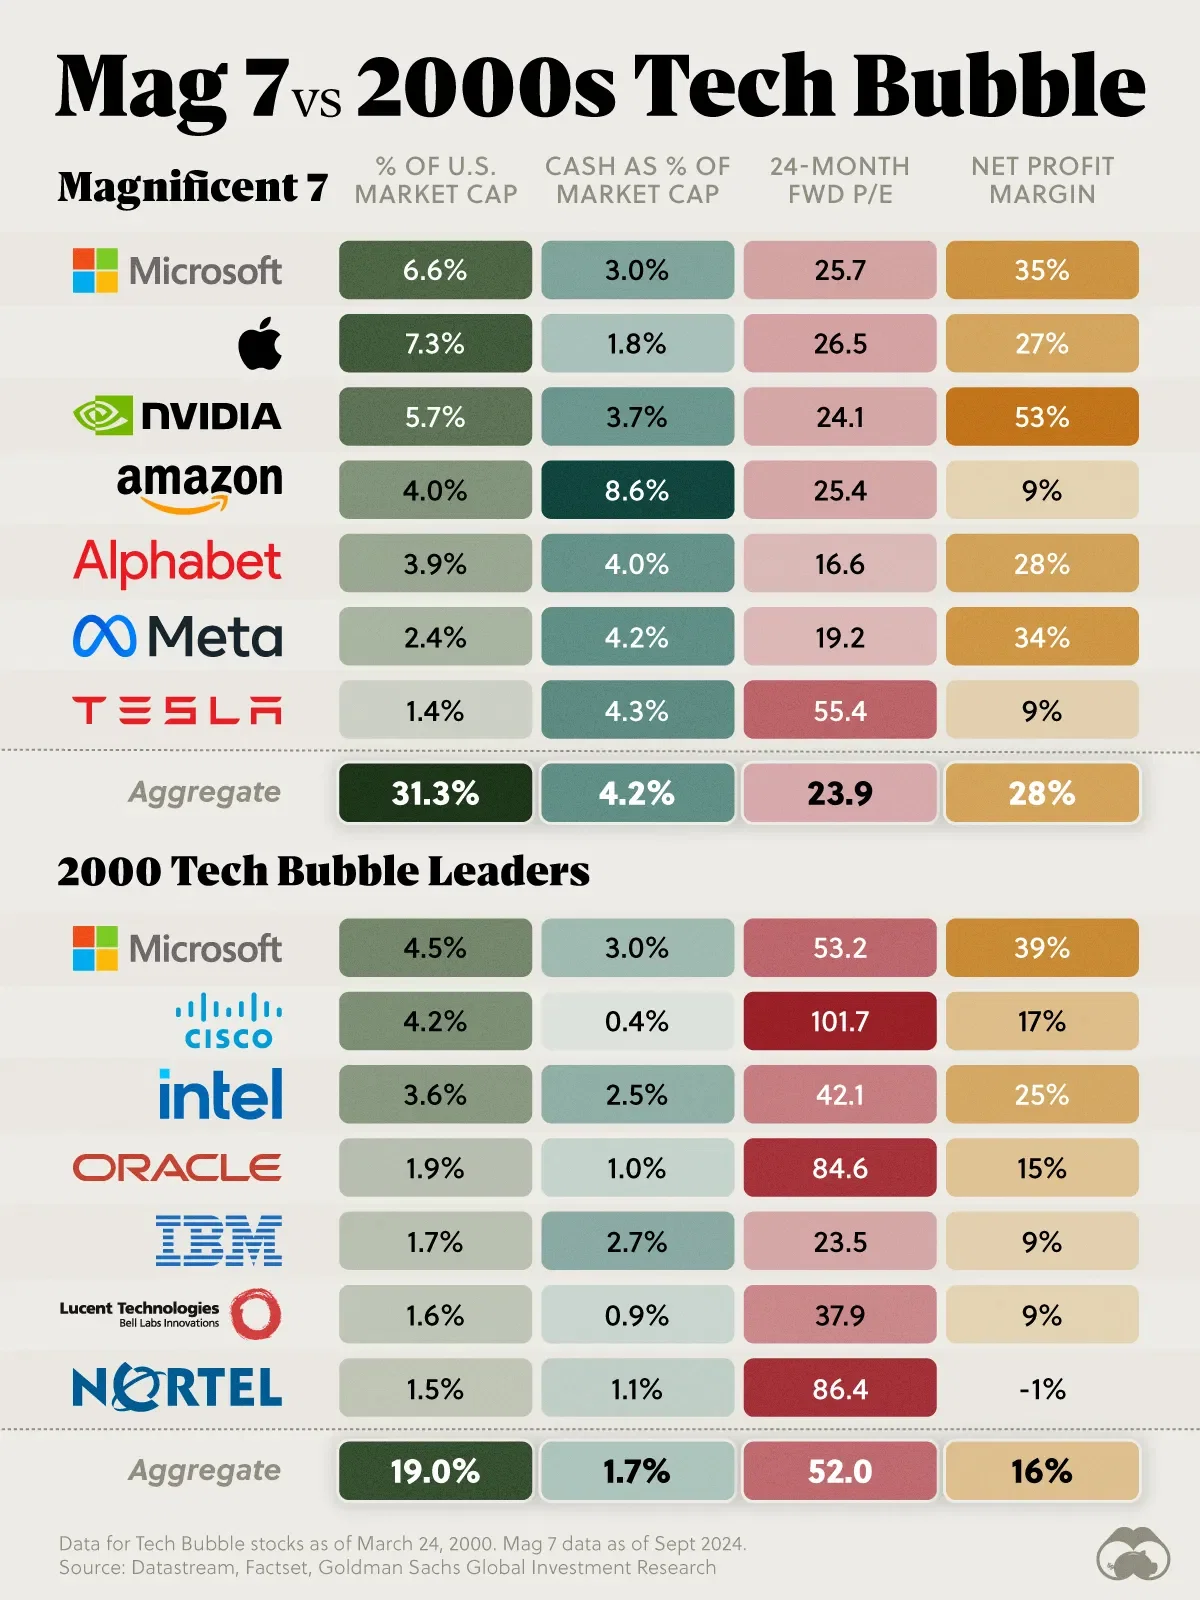
This graphic compares today’s Magnificent Seven stocks with seven of the top stocks from the 2000s Tech Bubble. Data was accessed from Goldman Sach’s Global Strategy Paper (Sept 5, 2024).
In terms of market cap, the Mag 7 represents over 30% of the U.S. market, which is significantly more than the 19% held by the seven leading tech stocks in the 2000s.
Such a high concentration among very few companies could be a source of risk, though as this dataset shows, Mag 7 stocks are relatively strong.
Compared to the 2000s group, they have higher profit margins, larger cash reserves, and are more attractively priced (as evidenced by their lower forward P/E ratios).