Where Data Tells the Story
© Voronoi 2026. All rights reserved.
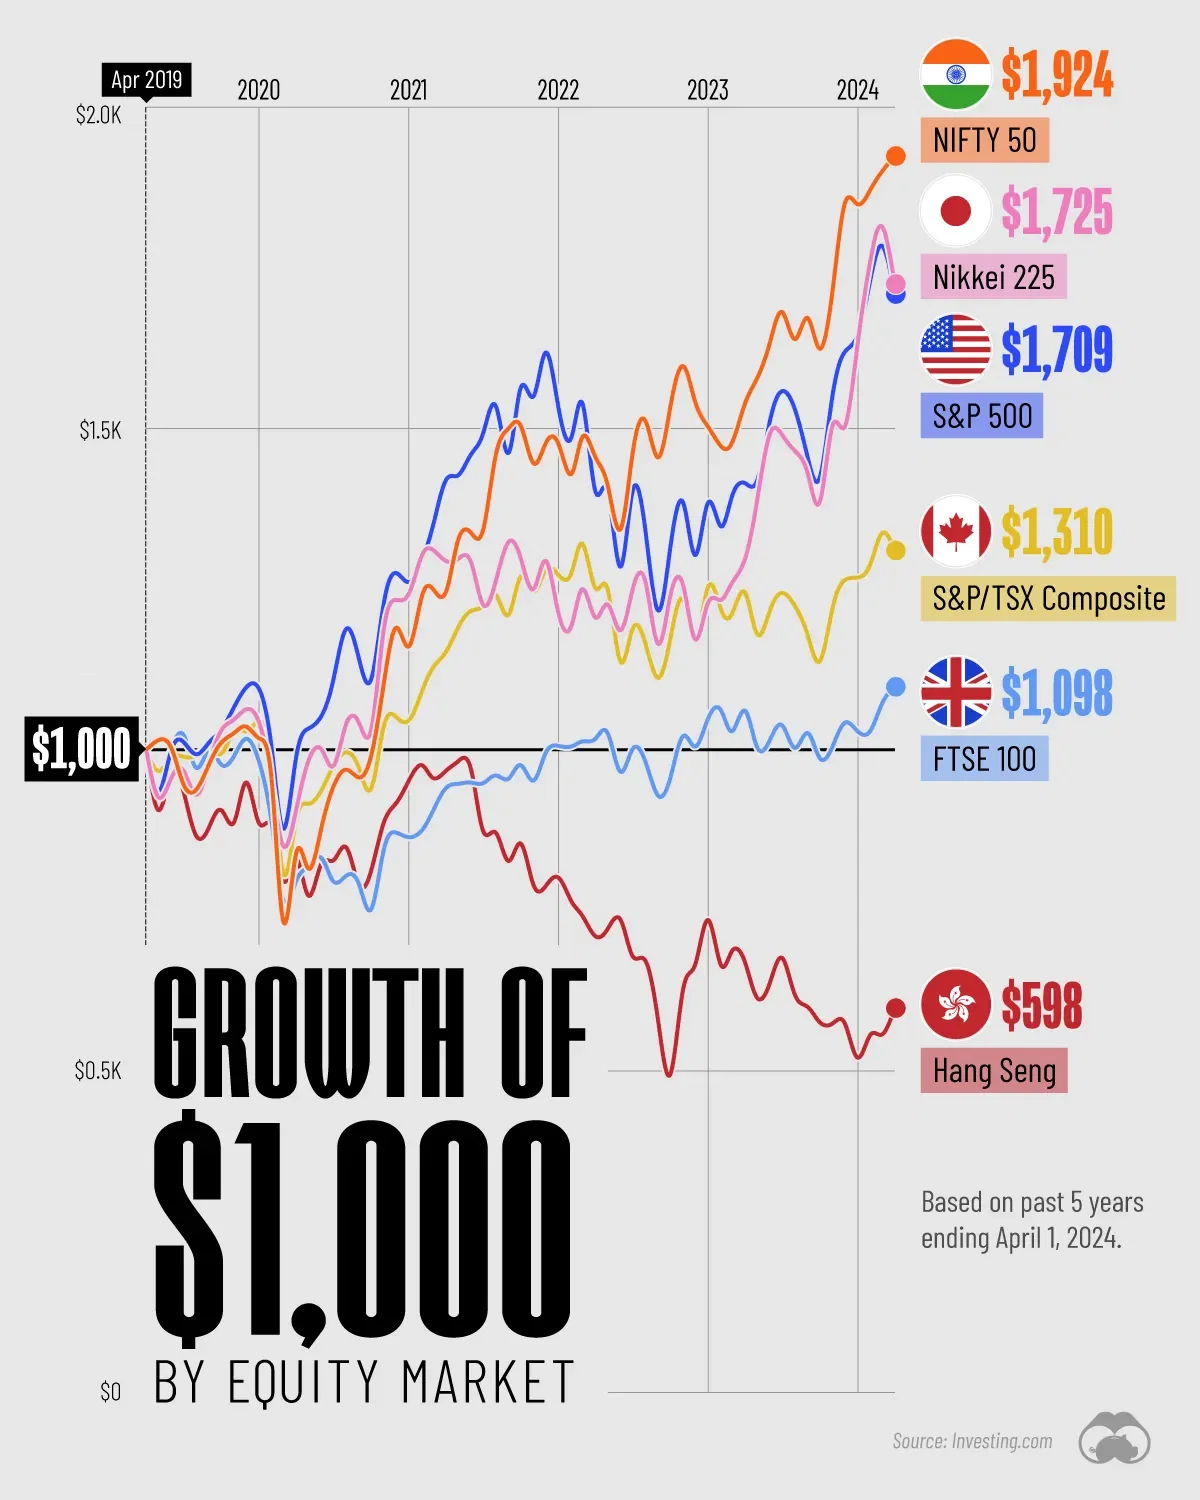
This chart shows the growth (or decline) of a $1,000 USD investment in various leading equity indexes from around the world.
This data was sourced from Investing.com, and covers the 5-year period from April 1, 2019 to April 1, 2024.
The NIFTY 50 is an index of the 50 largest and most actively traded Indian stocks.
Similar to the S&P 500, it represents a range of industries and acts as a benchmark for investors to gauge the performance of the broader Indian stock market.