Sep 18, 2024
How Does the S&P 500 Perform After Rate Cuts? ✂️

What We’re Showing
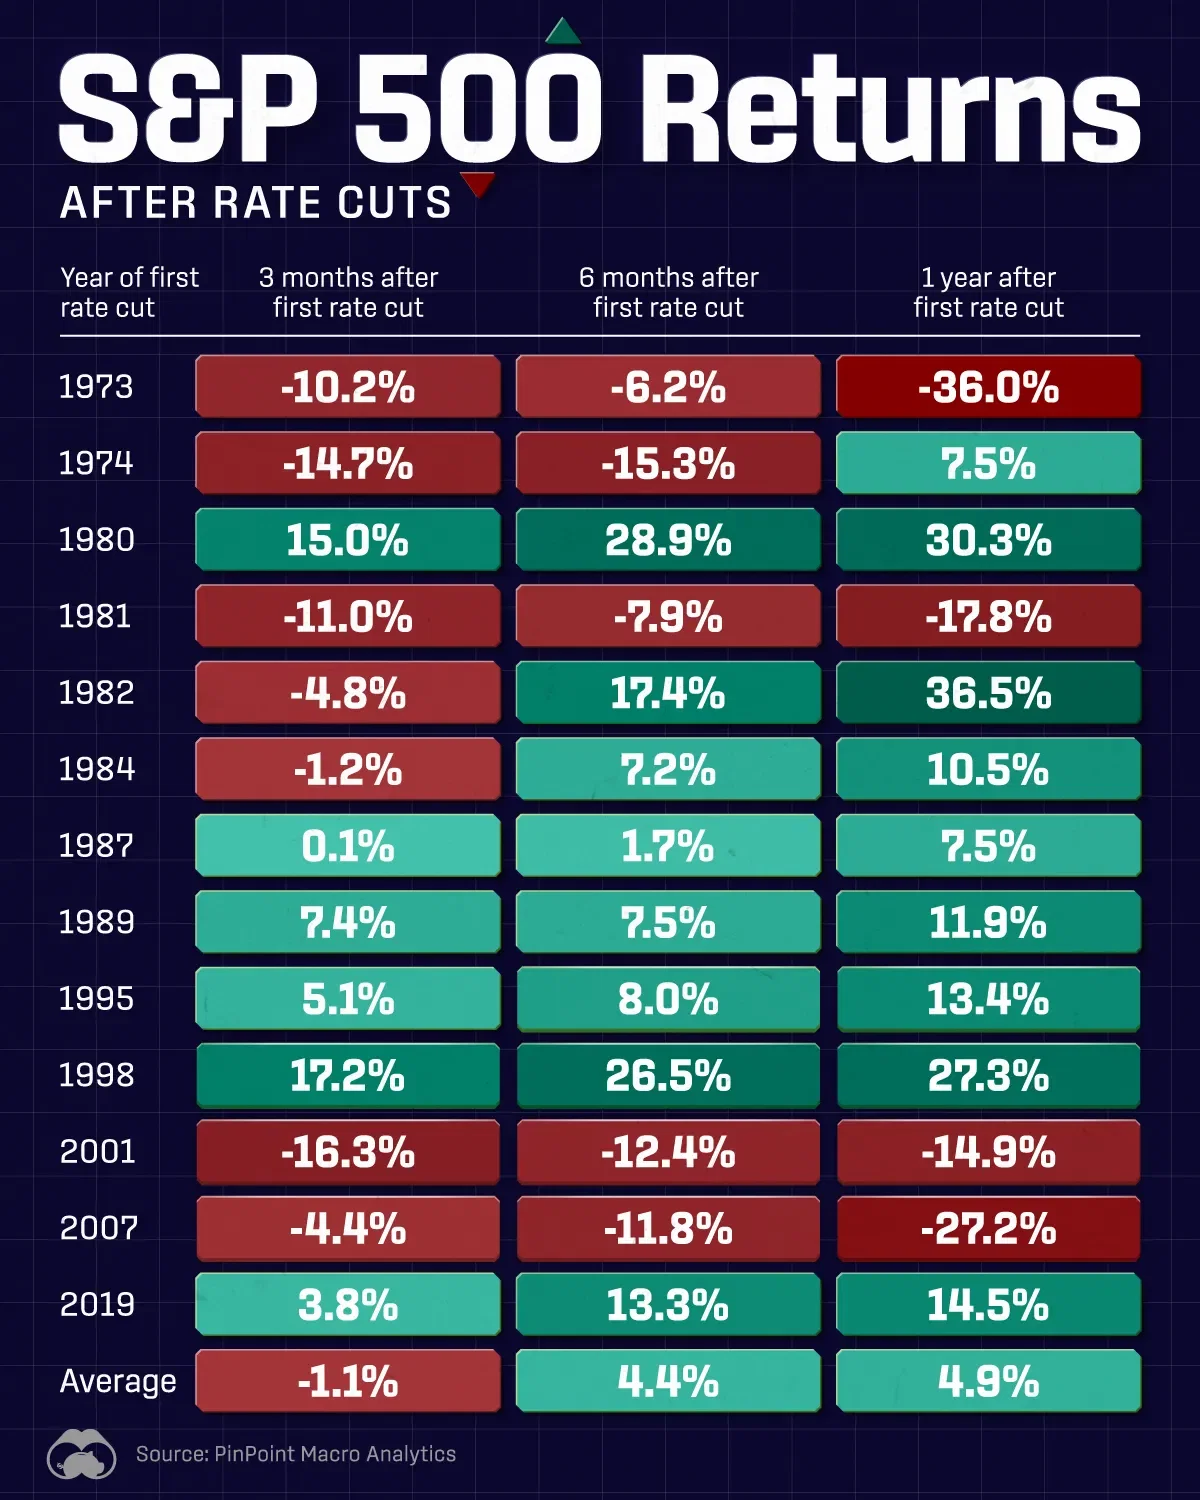
This graphic shows S&P 500 returns after interest rate cuts since 1973, based on data from PinPoint Macro Analytics.
Key Takeaways
- Historically, the S&P 500 returns 4.9% on average one year after the first interest rate cut
- Across 13 rate cut cycles since 1973, the S&P 500 has seen positive annual returns after the first rate cut, with the strongest years being in the early 1980s
- In the first three months following a rate cut, the market tends to decline, but typically rebounds six months after