Where Data Tells the Story
© Voronoi 2025. All rights reserved.

Historical Trends of the Oil-to-Gold Price Ratio (1960–2024)
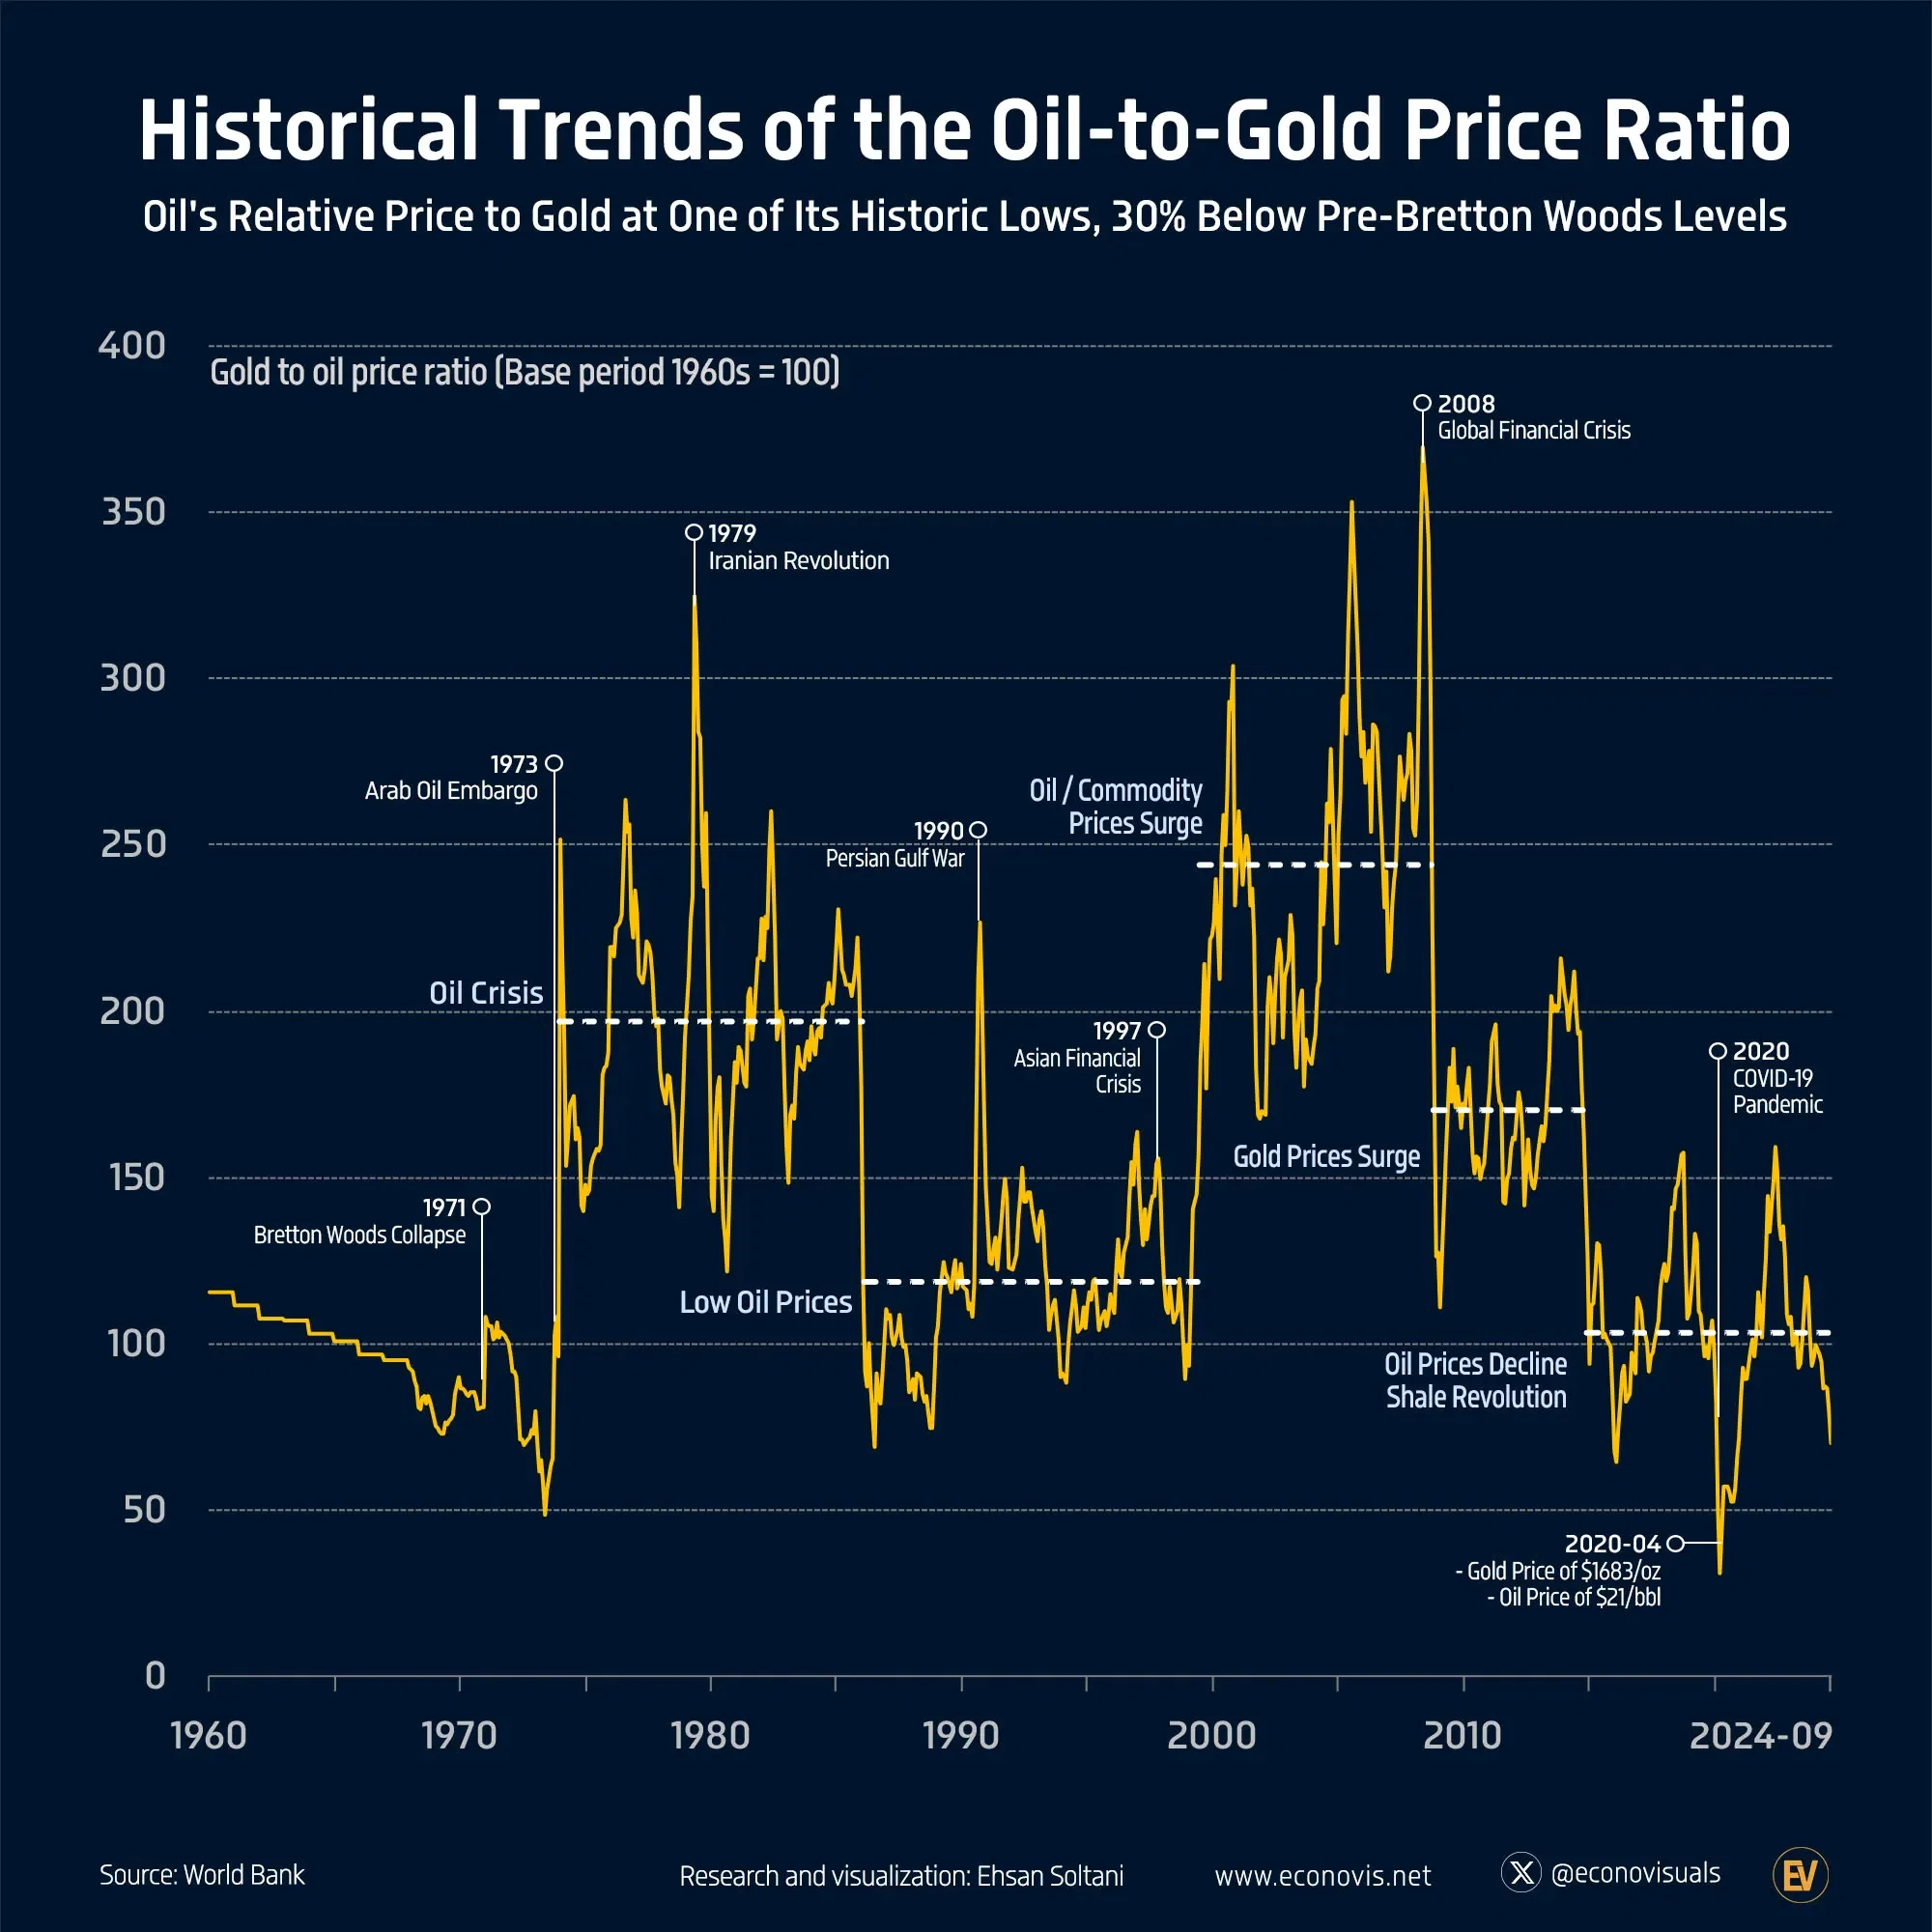
The oil-to-gold price ratio has experienced significant fluctuations since the collapse of the Bretton Woods system in the early 1970s, with five distinct periods:
1. Oil Crisis (mid-1970s–mid-1980s)
Geopolitical tensions, including the Arab oil embargo and the Iranian Revolution, led to major fluctuations. During this period, the oil-to-gold price ratio averaged nearly twice the levels seen in the 1960s.
2. Low Oil Prices (mid-1980s–1990s)
Oil prices dropped substantially, while gold prices remained relatively stable. As a result, the oil-to-gold price ratio averaged 19% higher than in the 1960s.
3. Oil and Commodity Prices Surge (2000–2008)
Driven largely by China’s growing demand, oil prices surged, causing the oil-to-gold price ratio to increase to an average of 144% above 1960s levels.
4. Gold Prices Surge (2008–mid-2010s)
Following the 2008 Global Financial Crisis, gold prices soared, leading to a decline in the oil-to-gold price ratio, which averaged 70% above 1960s levels.
5. Oil Prices Decline / Shale Revolution (mid-2010s–2024)
As the shale revolution reduced U.S. dependence on oil, prices fell, while gold prices increased. By September 2024, the oil-to-gold price ratio had declined sharply to levels 30% below the 1960s average—lower than in any of the previous periods (which ranged from 4% to 144% above the 1960s level).