π How the U.S. IPO Market is Becoming More Global
What Weβre Showing
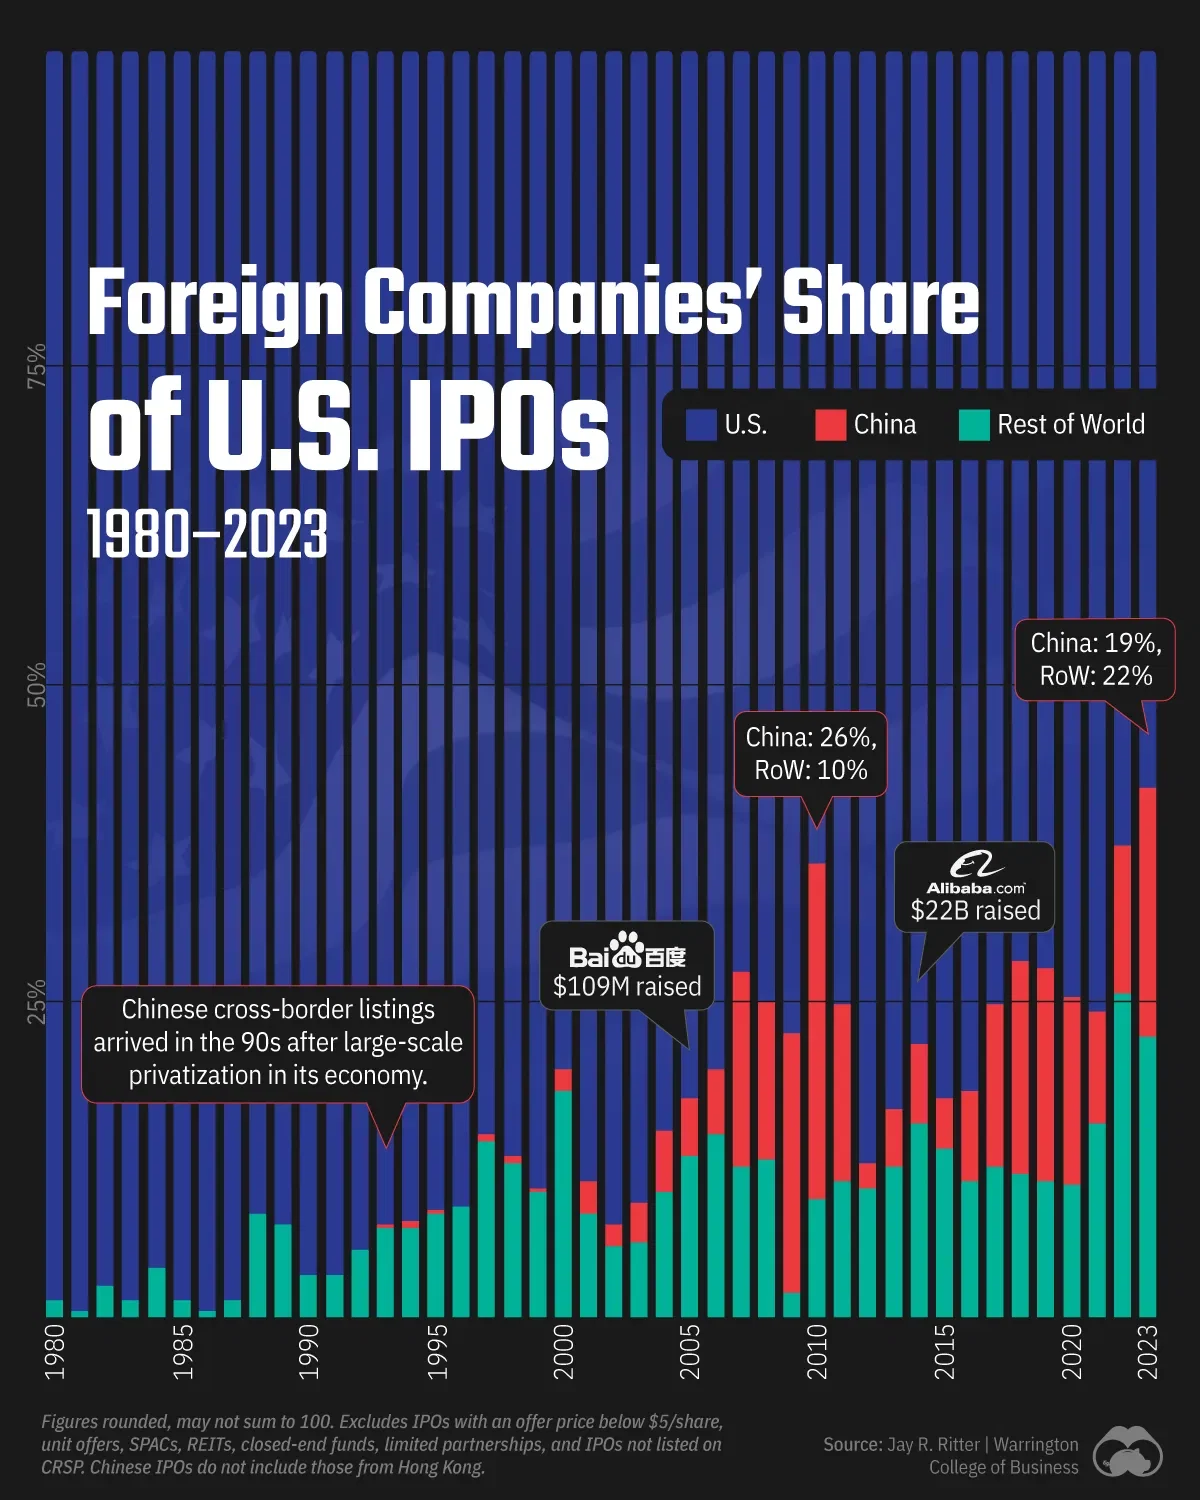
A chart tracking the share of foreign companies in all U.S. IPOs from 1980β2023, divided between China and the Rest of the World. Data sourced from IPO Statistics, a database maintained by Jay R. Ritter at Warrington College of Business.
The Impact of China
Chinese listings on U.S. exchanges began to pick up steam in the early '00s. The trend reached its apex in 2010, when Chinese companies accounted for more than one-fourth of all U.S. IPOs by themselves.
The next five years saw a steady contraction in new listings as the Chinese economy slowed down, and various headwinds kept Chinese companies from rushing the Nasdaq and NYSE. The U.S.-China trade war impacted the pace of new listings, and the Chinese government itself has discouraged companies from listing on foreign exchanges. In 2021, ride-sharing company Didi Global was compelled to delist from the NYSE after data-sharing concerns.
In spite of these barriers, Chinese IPOs in the U.S. are slowly ticking upwards again.
Dataset
Year | Chinese Companies | Rest of World | U.S. Companies |
---|---|---|---|
1980 | 0.0% | 1.4% | 98.6% |
1981 | 0.0% | 0.5% | 99.5% |
1982 | 0.0% | 2.6% | 97.4% |
1983 | 0.0% | 1.5% | 98.5% |
1984 | 0.0% | 4.0% | 96.0% |
1985 | 0.0% | 1.6% | 98.4% |
1986 | 0.0% | 0.5% | 99.5% |
1987 | 0.0% | 1.4% | 98.6% |
1988 | 0.0% | 8.3% | 91.7% |
1989 | 0.0% | 7.6% | 92.4% |
1990 | 0.0% | 3.6% | 96.4% |
1991 | 0.0% | 3.5% | 96.5% |
1992 | 0.0% | 5.5% | 94.5% |
1993 | 0.2% | 7.2% | 92.6% |
1994 | 0.7% | 7.1% | 92.1% |
1995 | 0.2% | 8.4% | 91.4% |
1996 | 0.1% | 8.9% | 91.0% |
1997 | 0.8% | 13.9% | 85.3% |
1998 | 0.7% | 12.2% | 87.1% |
1999 | 0.2% | 10.0% | 89.8% |
2000 | 1.7% | 17.9% | 80.4% |
2001 | 2.4% | 8.4% | 89.2% |
2002 | 1.5% | 5.9% | 92.6% |
2003 | 3.0% | 6.1% | 90.9% |
2004 | 4.8% | 10.1% | 85.2% |
2005 | 4.7% | 12.8% | 82.6% |
2006 | 5.2% | 14.5% | 80.2% |
2007 | 15.3% | 12.1% | 72.6% |
2008 | 12.5% | 12.5% | 75.0% |
2009 | 20.4% | 2.0% | 77.6% |
2010 | 26.4% | 9.6% | 64.0% |
2011 | 14.0% | 10.8% | 75.3% |
2012 | 2.1% | 10.3% | 87.6% |
2013 | 4.8% | 11.9% | 83.3% |
2014 | 6.2% | 15.6% | 78.2% |
2015 | 4.0% | 13.5% | 82.5% |
2016 | 7.2% | 10.8% | 81.9% |
2017 | 12.8% | 12.0% | 75.2% |
2018 | 16.9% | 11.4% | 71.7% |
2019 | 16.7% | 10.9% | 72.5% |
2020 | 14.6% | 10.6% | 74.7% |
2021 | 8.6% | 15.6% | 75.8% |
2022 | 11.6% | 25.6% | 62.8% |
2023 | 19.4% | 22.4% | 58.2% |
Data sources
Figures rounded. Excludes IPOs with an offer price below $5/share, unit offers, SPACs, REITs, closed-end funds, natural resource limited partnerships, and IPOs not listed on CRSP. Chinese IPOs do not include those from Hong Kong.