
Where Data Tells the Story
© Voronoi 2026. All rights reserved.

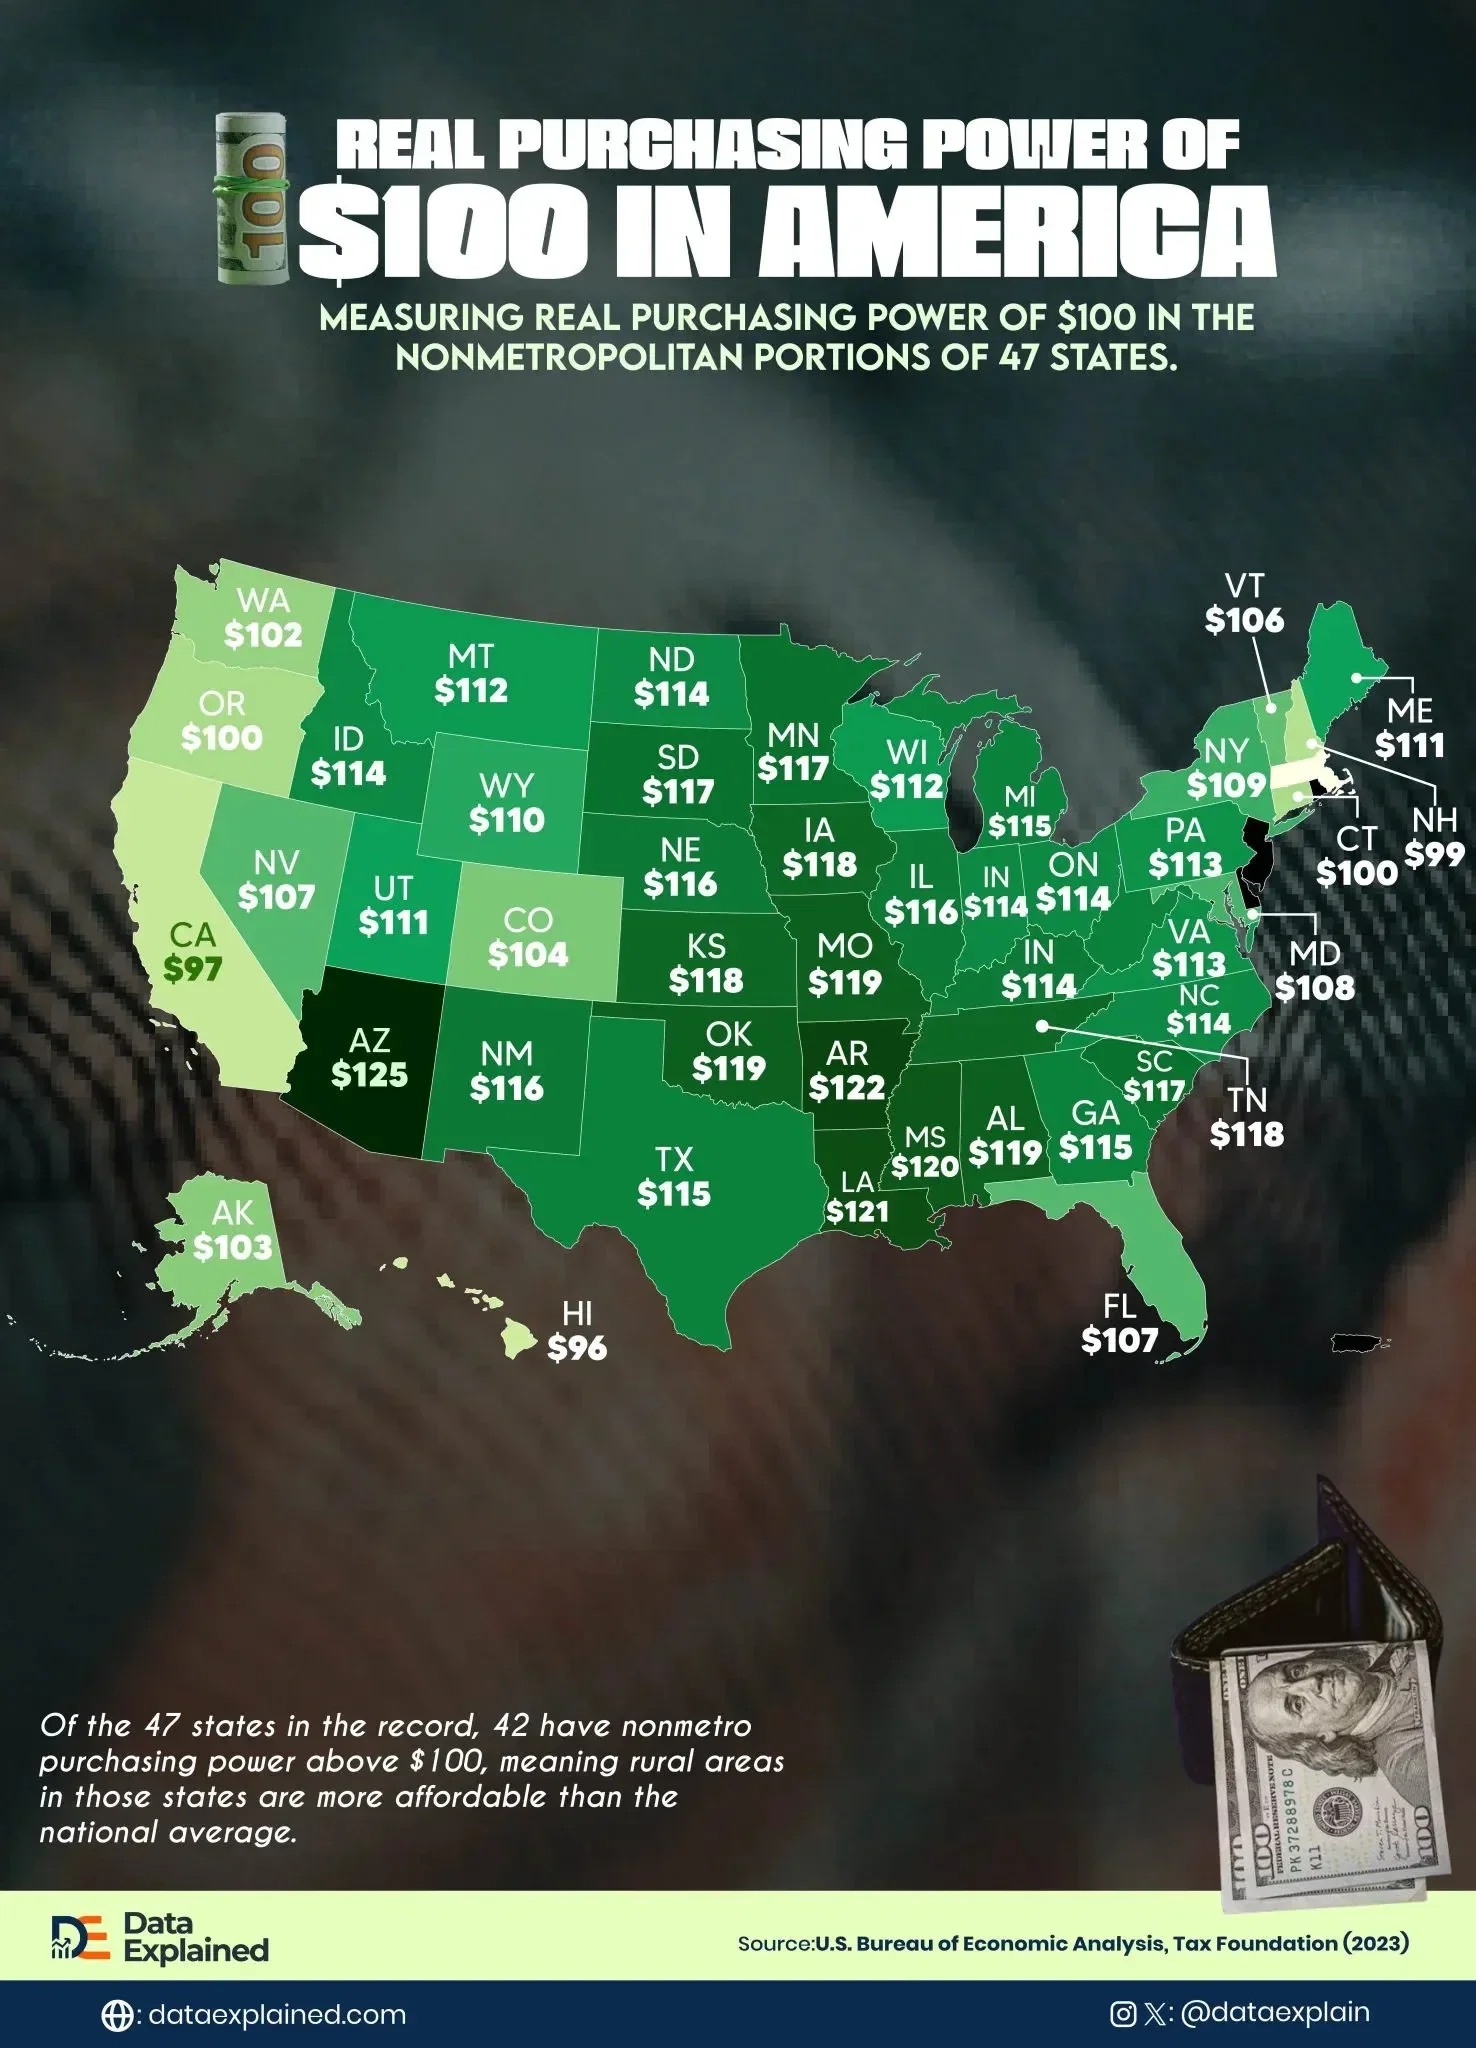
Rural America is cheaper than the national average almost everywhere.
Of the 47 states with recorded nonmetropolitan populations, 42 have rural purchasing power above $100.
This means a dollar goes further in their countryside than it does at the national baseline.
The map above is based on data harvested from the U.S. Bureau of Economic Analysis, published by the Tax Foundation for 2023.
It measures the real purchasing power of $100 in the nonmetropolitan portions of 47 states.
Of the 47 states in the record, 42 have nonmetro purchasing power above $100, meaning rural areas in those states are more affordable than the national average.
Only five do not: Massachusetts ($91.11), Hawaii ($96.28), California ($97.47), New Hampshire ($98.78), and Connecticut ($99.83).
All five are coastal or New England states.
Their shared characteristic is that high urban costs extend into rural communities, through housing demand, labor market spillovers, and service price levels that do not drop as sharply outside city limits as they do in most of the country.
California is the most practically significant of the five.
The assumption that leaving a California city for the Central Valley, the Sierra foothills, or the North Coast solves the affordability problem is not supported by the data.
Housing in rural California costs more than the national average. Rural Arkansas ($121.69), rural Mississippi ($119.50), and rural Missouri ($119.46) all offer significantly greater purchasing power than California’s countryside.