MapsMay 26, 2024
Between U.S. States, There is Huge Variance in Spending per Prisoner
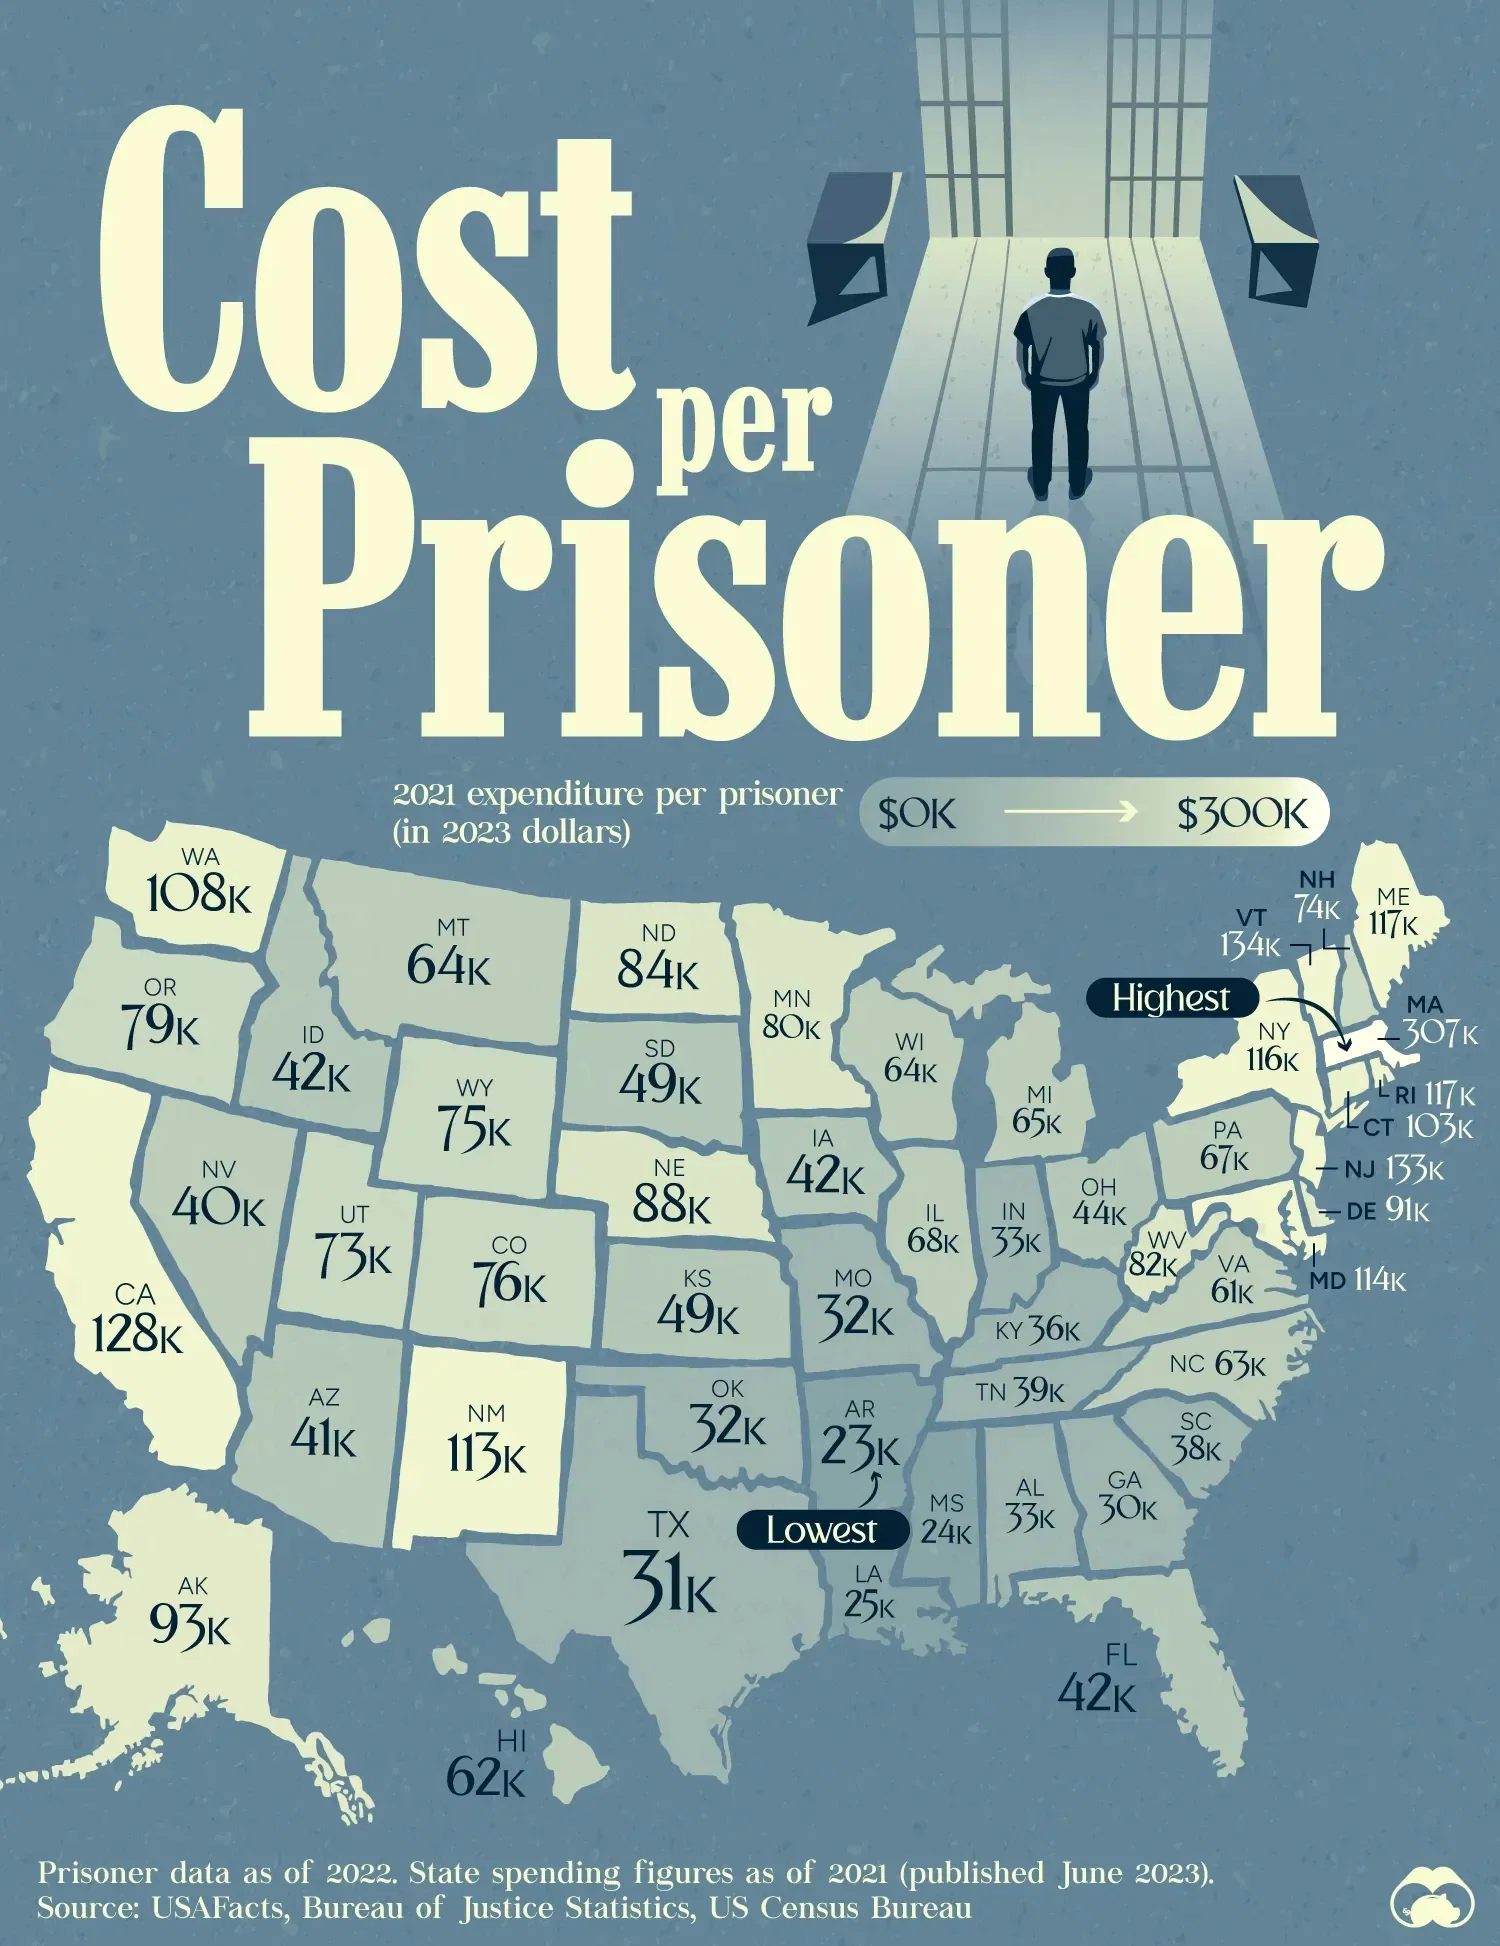
What We’re Showing?
Spending per prisoner across U.S. states. These figures were accessed via USAFacts. Spending data was sourced from the US Census Bureau Annual Survey of State and Local Government Finances (last updated in June 2023). Prison population data was sourced from the Bureau of Justice Statistics (last updated November 2023).
Key Takeaways
- Spending varies from just under $23,000 per prisoner in Arkansas to $307,468 in Massachusetts
- States allocate most of their budgets to prisons to pay for day-to-day operations, including officer salaries
- In high-wage states such as California, New Jersey, and Massachusetts, officers receive double the salaries compared to those in lower-wage states like Mississippi, Missouri, and Kentucky
Dataset
State | Expenditure per prisoner, adjusted for inflation (USD) |
---|---|
Massachusetts | 307K |
Vermont | 134K |
New Jersey | 133K |
California | 128K |
Maine | 117K |
Rhode Island | 117K |
New York | 116K |
Maryland | 114K |
New Mexico | 113K |
Washington | 108K |
Connecticut | 103K |
Alaska | 93K |
Delaware | 91K |
Nebraska | 88K |
North Dakota | 84K |
West Virginia | 82K |
Minnesota | 80K |
Oregon | 79K |
Colorado | 76K |
Wyoming | 75K |
New Hampshire | 74K |
Utah | 73K |
Illinois | 68K |
Pennsylvania | 67K |
Michigan | 65K |
Wisconsin | 64K |
Montana | 64K |
North Carolina | 63K |
Hawaii | 62K |
Virginia | 61K |
Kansas | 49K |
South Dakota | 49K |
Ohio | 44K |
Idaho | 42K |
Iowa | 42K |
Florida | 42K |
Arizona | 41K |
Nevada | 40K |
Tennessee | 39K |
South Carolina | 38K |
Kentucky | 36K |
Indiana | 33K |
Alabama | 33K |
Missouri | 32K |
Oklahoma | 32K |
Texas | 31K |
Georgia | 30K |
Louisiana | 25K |
Mississippi | 24K |
Arkansas | 23K |
49
0
26.0K