
Where Data Tells the Story
© Voronoi 2026. All rights reserved.

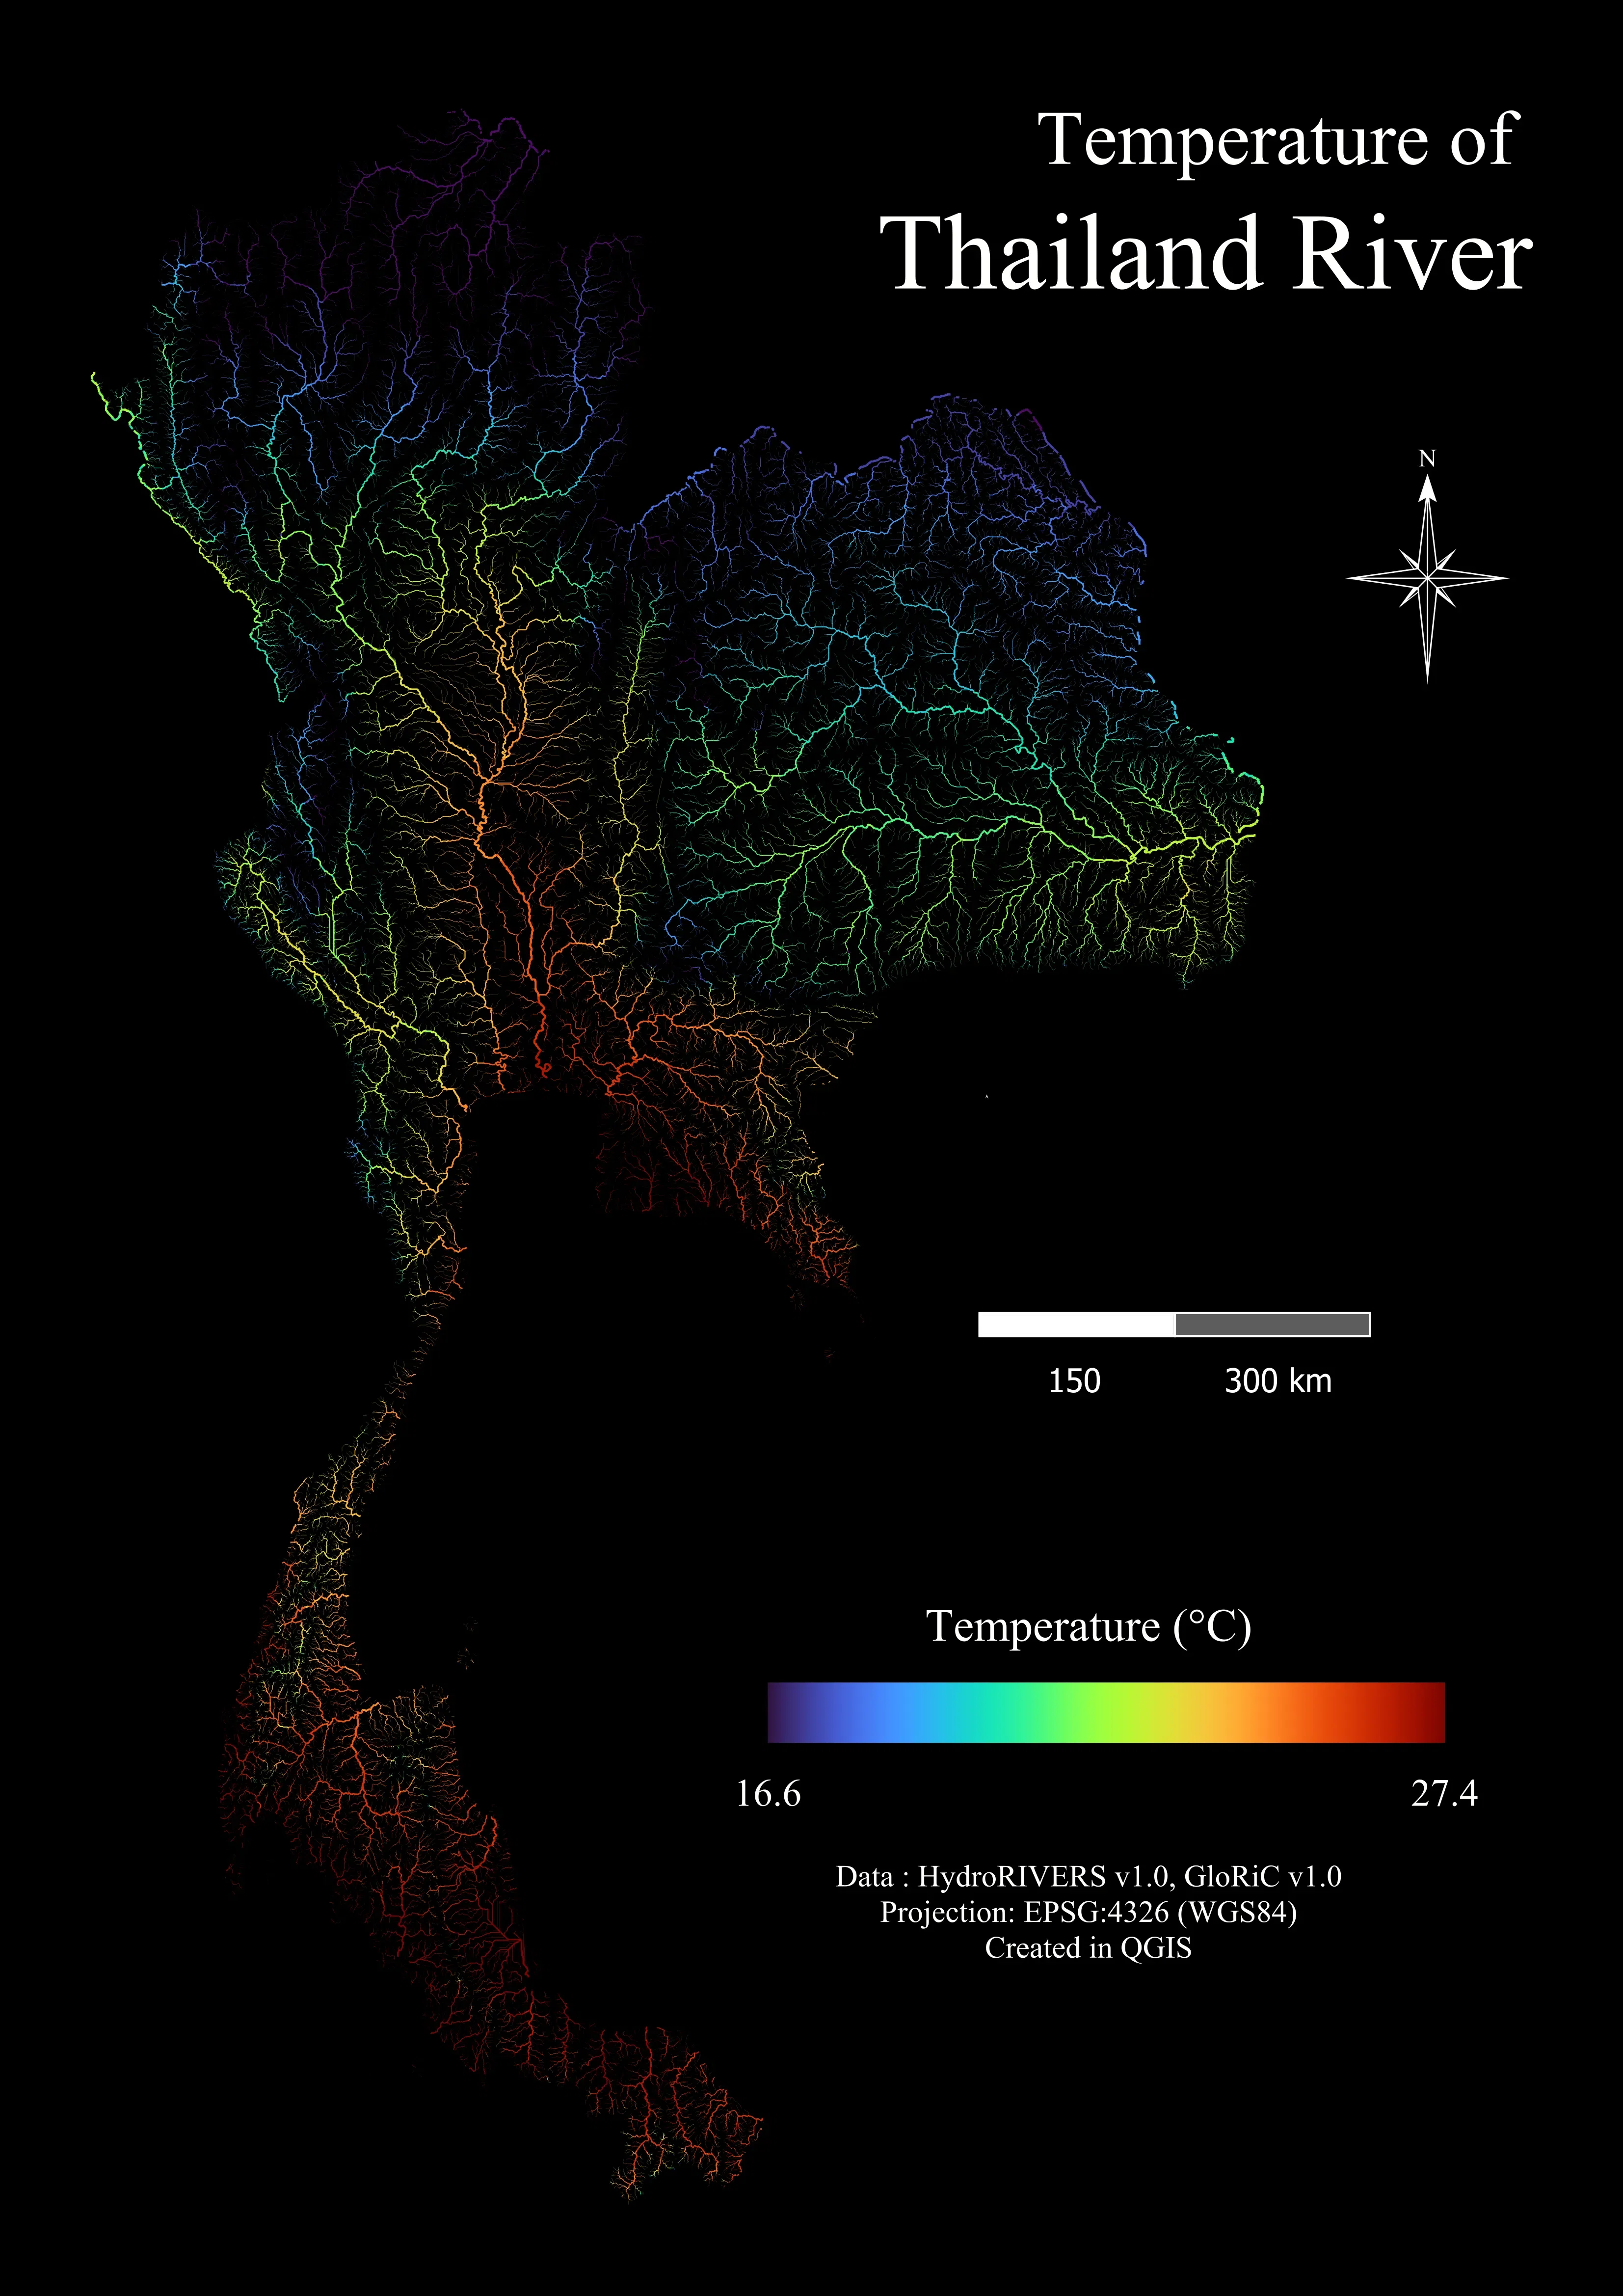
This map visualizes the spatial distribution of river temperatures across Thailand’s river network. River data from HydroRIVERS were integrated with temperature datasets and processed using QGIS to reveal temperature variations throughout the country.
The visualization highlights clear geographic patterns: cooler temperatures are generally observed in the northern highlands and upstream regions, while warmer temperatures dominate the lowland areas and southern peninsula.
📍 Data : HydroRIVERS v1.0, GloRiC v1.0
🗺️ Visualization : QGIS