Where Data Tells the Story
© Voronoi 2026. All rights reserved.
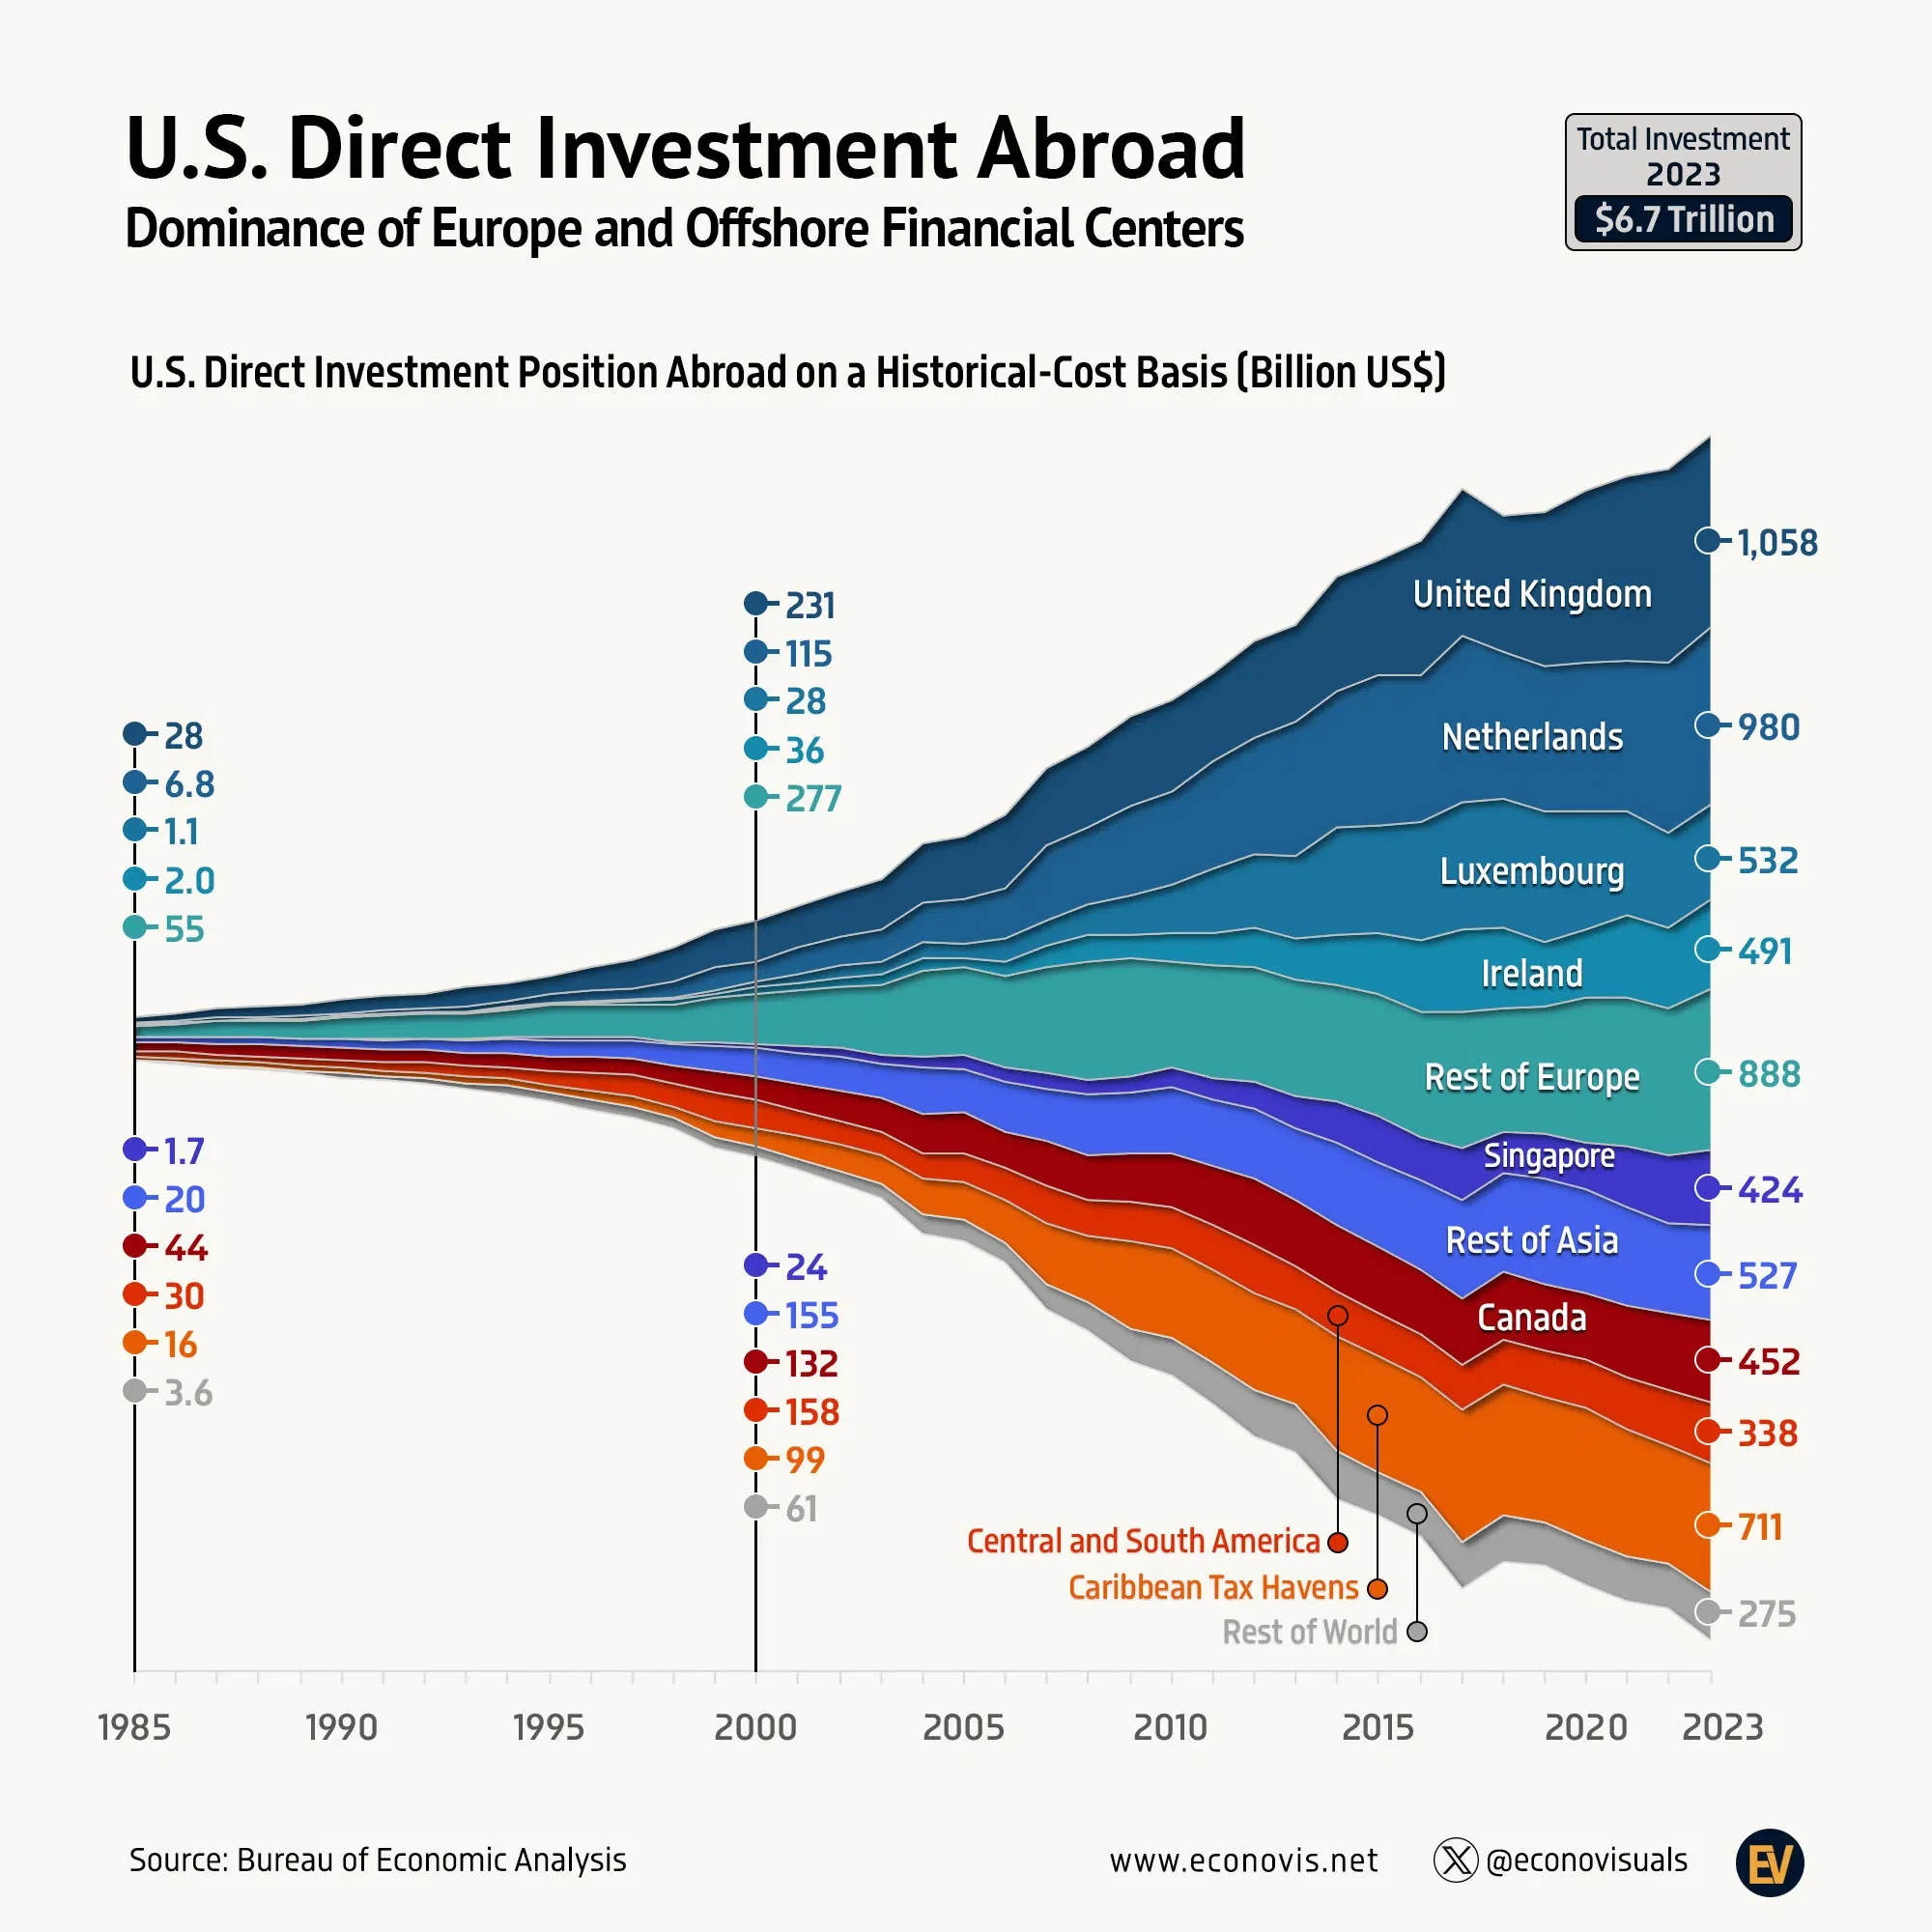
From 1990 to 2023, U.S. direct investment abroad grew at a compound annual rate of 8.7%, rising from $0.43 trillion to $6.68 trillion. As of 2023, 59% of total U.S. direct investment abroad was allocated to Europe, increasing at an 8.8% annual rate to reach $3.95 trillion. The largest European recipients were:
· United Kingdom: $1.06 trillion (15.8% of total)
· Netherlands: $980 billion (14.7%)
· Luxembourg: $532 billion (8.0%)
· Ireland: $491 billion (7.4%)
· Switzerland: $238 billion (3.6%)
· Germany: $193 billion (2.9%)
In North America, U.S. investments in Canada totaled $452 billion (6.8%), while Mexico received $145 billion (2.2%).
Despite its economic size, China accounted for just 1.9% of total U.S. direct investment abroad in 2023, at $127 billion, underscoring its relatively limited role in overall U.S. foreign direct investment (FDI).
By 2023, 19% of total U.S. direct investment abroad was concentrated in Caribbean tax havens and Luxembourg, growing at an annual rate of 11.6% since the 1990s to reach $1.24 trillion. This included $711 billion in Caribbean tax havens and $532 billion in Luxembourg. The largest Caribbean recipients were:
· United Kingdom Caribbean islands: $399 billion
· Bermuda: $220 billion
· Bahamas: $46 billion
· Barbados: $45 billion
These jurisdictions provide secrecy laws, low or zero corporate tax rates, and regulatory loopholes that enable profit shifting, tax avoidance, and financial opacity.