Where Data Tells the Story
© Voronoi 2026. All rights reserved.
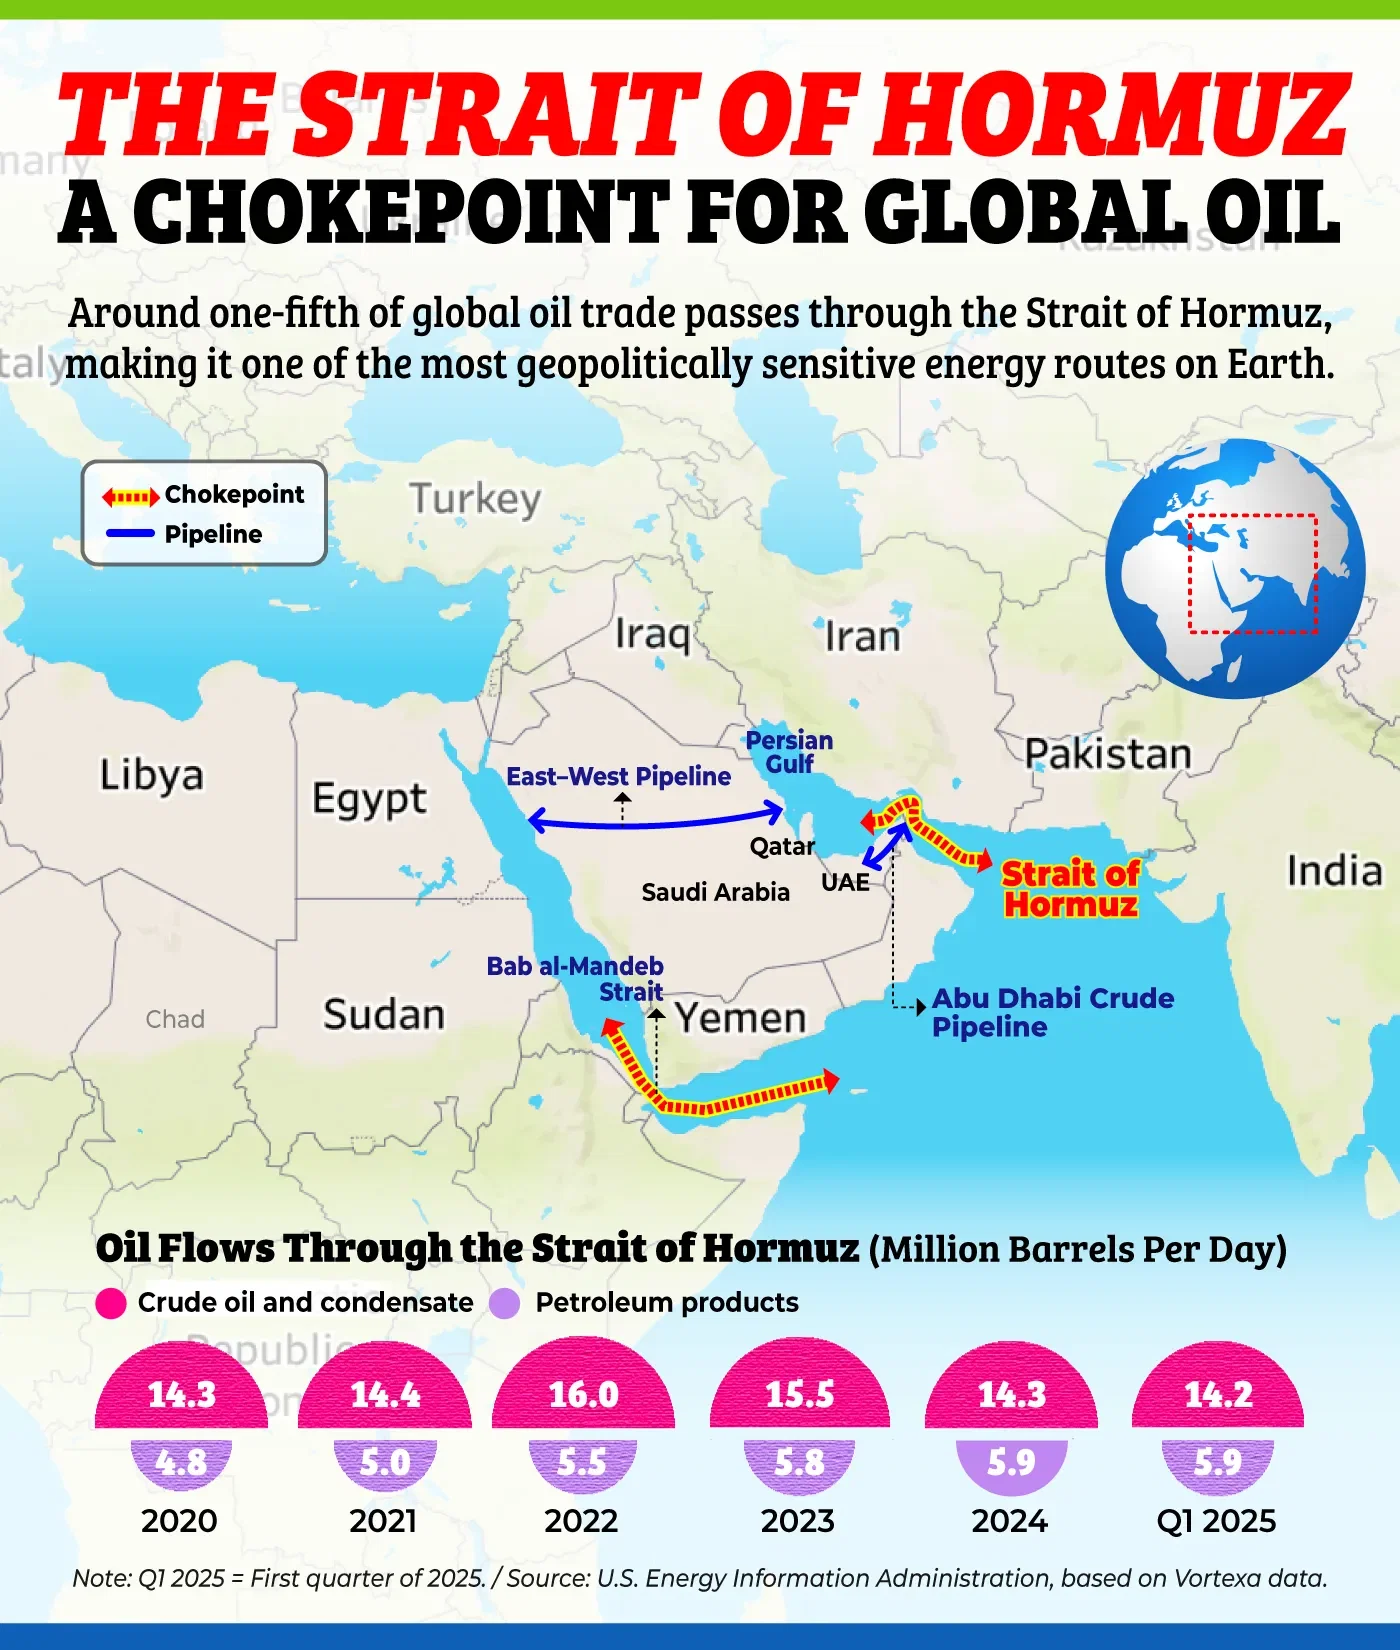
This map highlights the strategic importance of the Strait of Hormuz, the narrow maritime corridor through which roughly one-fifth of global oil trade flows. It maps the key energy routes connecting the Persian Gulf to international markets and tracks oil flows (crude and petroleum products) from 2020 to Q1 2025.
The visuals illustrate how this chokepoint underpins global energy security, with average flows hovering near 20 million barrels per day in recent years. Data is sourced from the U.S. Energy Information Administration, based on Vortexa tracking. Together, the map and flow data show why Hormuz remains one of the most geopolitically sensitive energy arteries in the world.
• Around 20% of global oil trade passes through Hormuz, making it one of the world’s most critical energy chokepoints. Even brief disruptions can trigger immediate price volatility.
• Oil flows peaked at 16.0 million barrels per day (crude) in 2022, before easing slightly in 2023–2024, reflecting shifting demand and production adjustments.
• Petroleum product shipments have steadily risen, reaching about 5.9 million barrels per day in 2024 and Q1 2025, indicating resilient downstream trade.
• A potential conflict between the United States and Iran would directly threaten tanker traffic, risking supply shocks across Asia and Europe.
• Energy markets remain highly exposed to geopolitical tensions in the Gulf, with limited alternative routes capable of fully replacing Hormuz volumes in the short term.
Source: U.S. Energy Information Administration analysis based on Vortexa.
Note: Q1 25 = first quarter of 2025.