Where Data Tells the Story
© Voronoi 2026. All rights reserved.
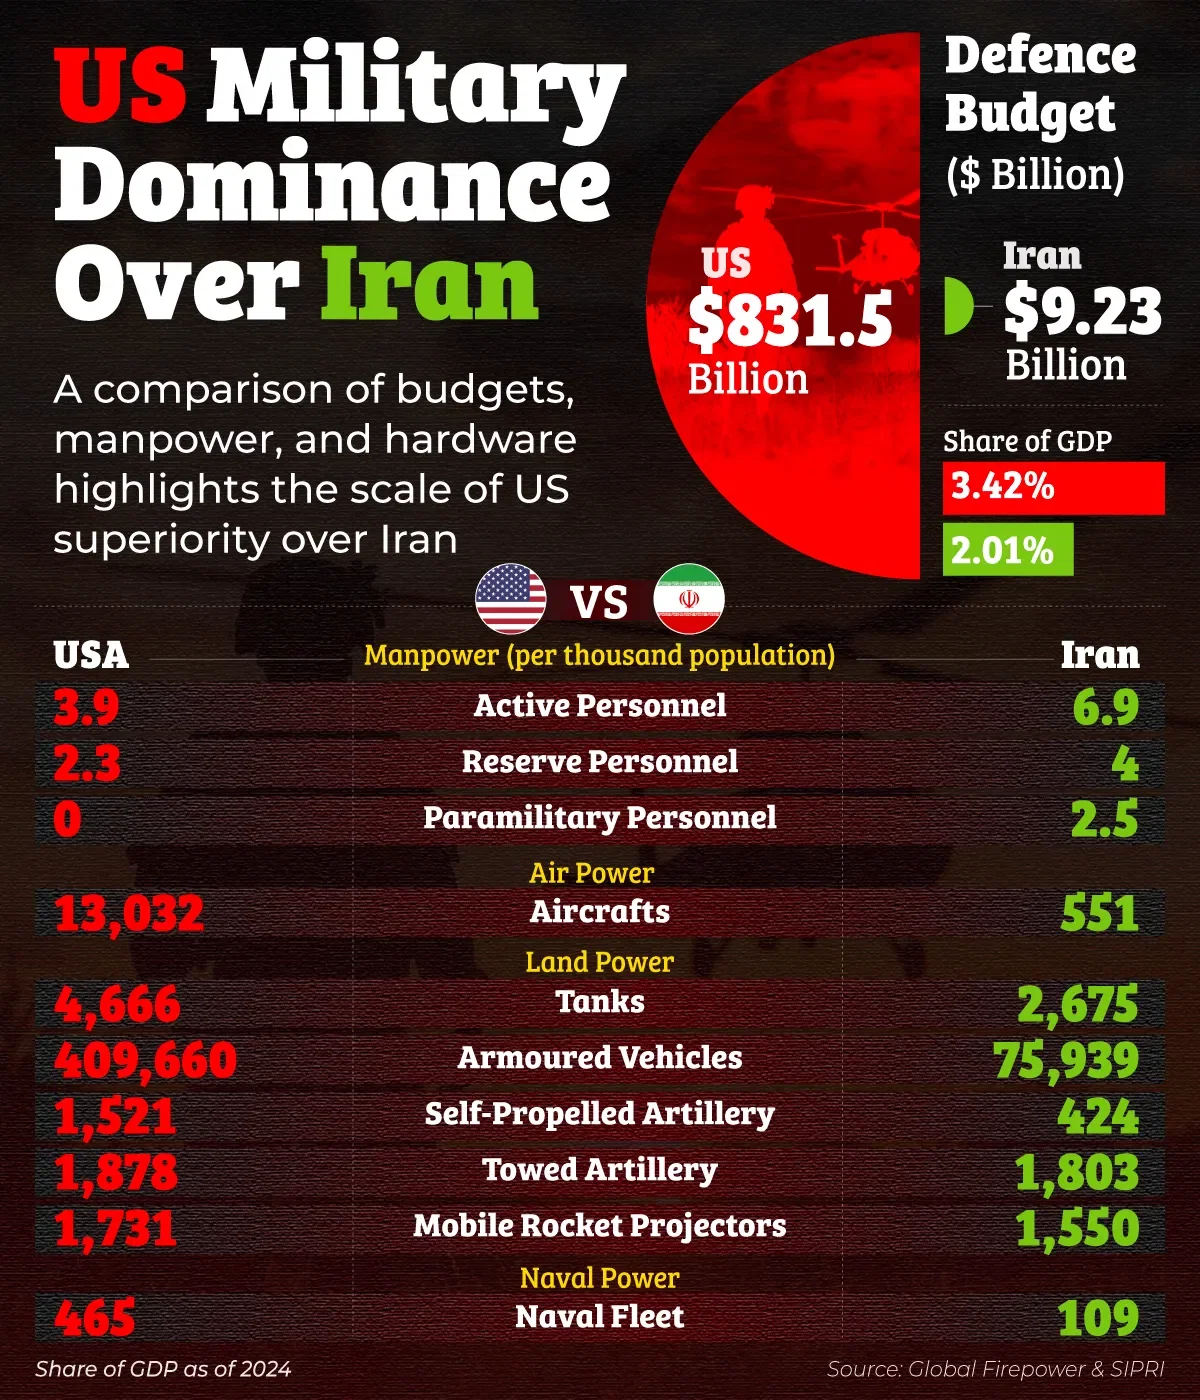
This graphic compares the military balance between the United States and Iran using defence spending, manpower, and key hardware indicators. It brings together budget data, force size per thousand population, and assets across air, land, and naval power to show how military capability is distributed between the two countries. By placing these metrics side by side, the visual highlights not just numerical differences, but the strategic asymmetry that defines the current US–Iran relationship. The data reflects recent defence figures and illustrates how scale, technology, and force composition shape deterrence dynamics between a global military power and a regional one.
Together, these contrasts explain why deterrence, not direct conflict, continues to define US–Iran geopolitics.
Note: GDP share data shown as of 2024.
Source: Global Firepower & SIPRI
https://www.sipri.org/sites/default/files/2025-04/2504_fs_milex_2024.pdf