
Where Data Tells the Story
© Voronoi 2026. All rights reserved.

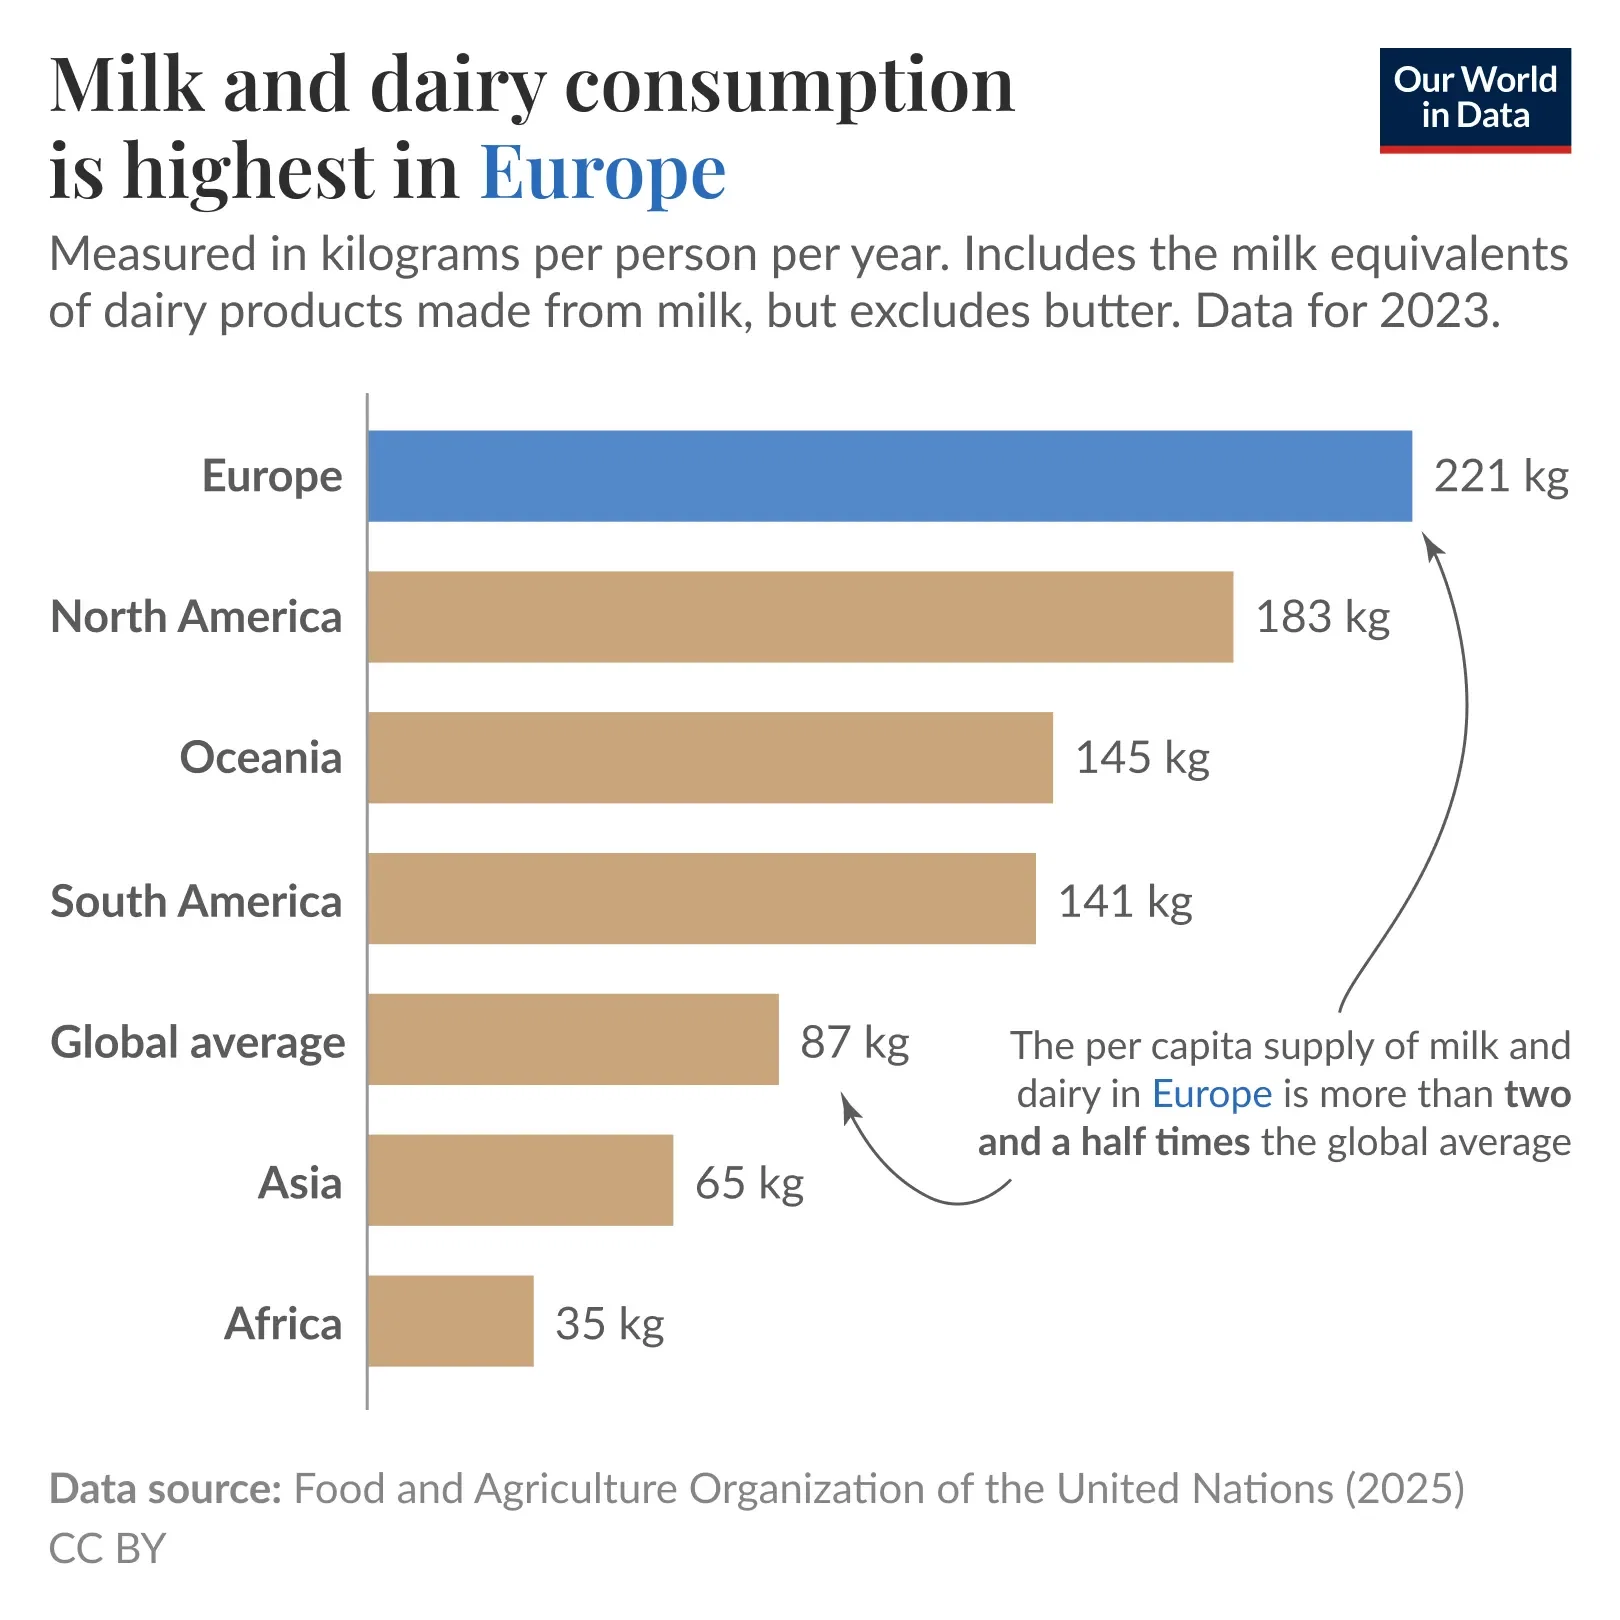
In Europe, the supply of dairy products is far higher than in other parts of the world.
This chart shows milk supply per person across the world’s regions, with data from the Food and Agriculture Organization of the United Nations.
It’s based on supply — the amount of milk available for consumption — which includes consumer waste, so it is slightly higher than the amount that people actually consume.
As you can see, the per capita supply in Europe is more than two and a half times the global average. People across Africa and Asia have far less available.
These numbers include dairy products such as yogurt and cheese, based on how much milk is used to produce them, but they do not include butter.