
Where Data Tells the Story
© Voronoi 2026. All rights reserved.

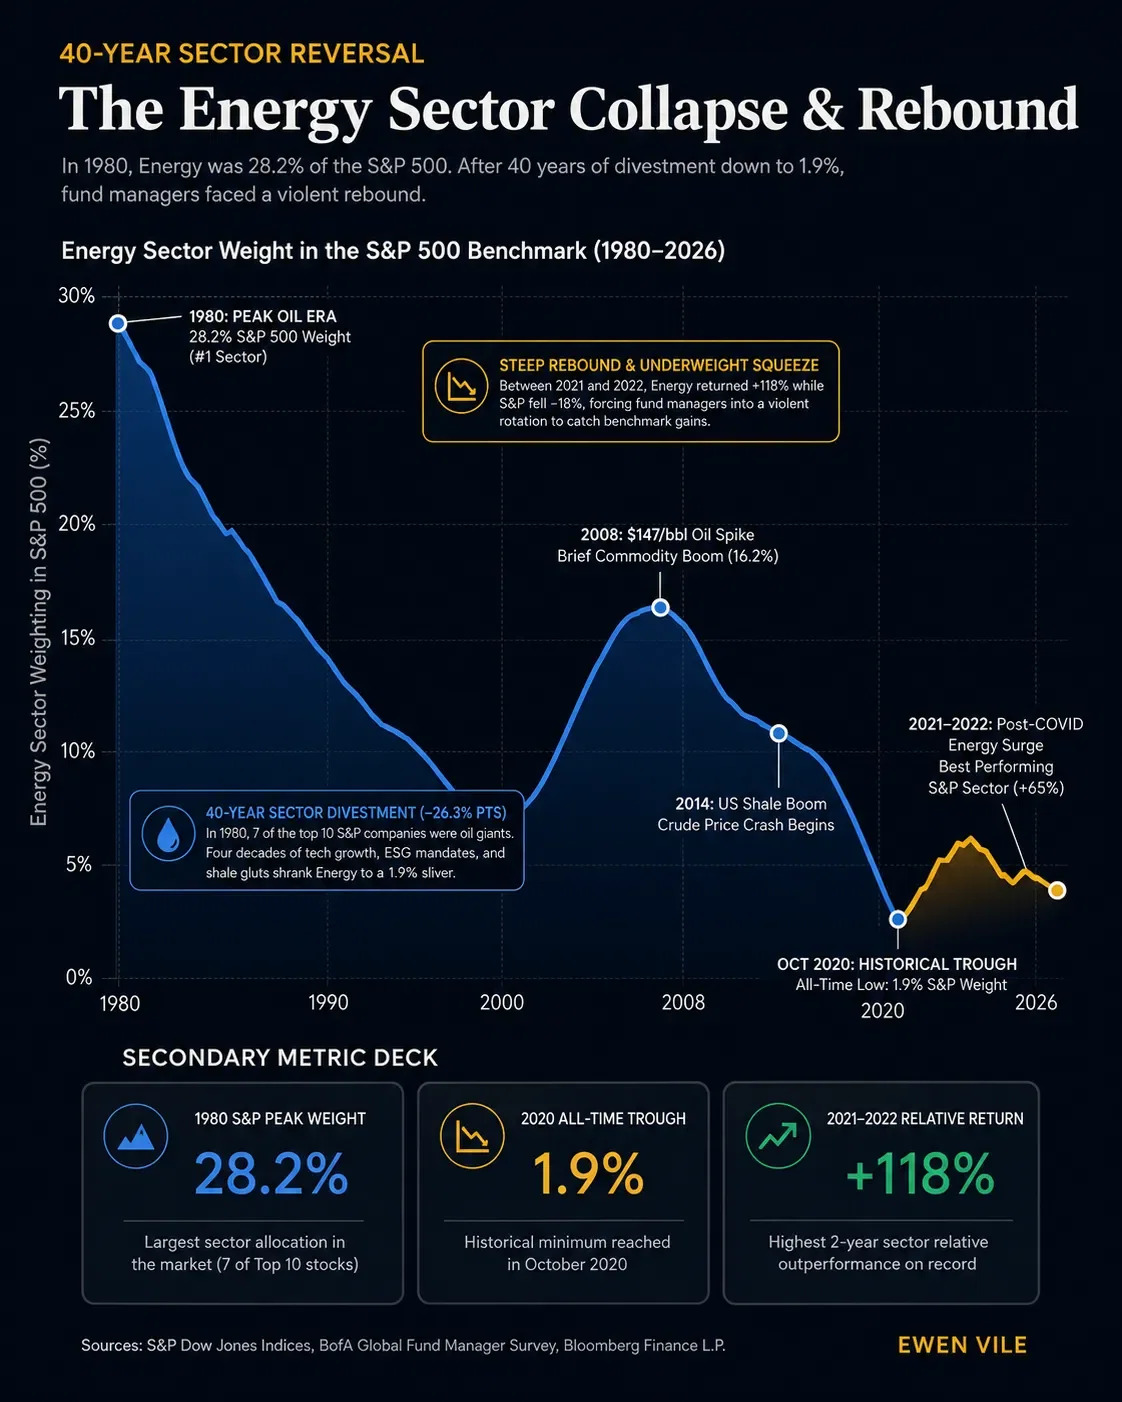
Four Decades of Institutional Divestment Reverses into a Violent Relative Rally (1980–2026)
In 1980, Energy was the undisputed king of institutional equity portfolios. Accounting for 28.2% of the S&P 500, seven of the top ten largest companies in the world were oil giants (Exxon, Mobil, Texaco, Standard Oil, Gulf Oil, Amoco, Chevron). Over the subsequent 40 years, fund managers executed the largest, most sustained sector divestment in stock market history: Driven by technological expansion, the US shale boom, falling oil prices, and accelerating ESG mandates, Energy's benchmark allocation collapsed from 28.2% in 1980 to an all-time historical trough of 1.9% in October 2020. Between 2021 and 2026, that 40-year underweight trend suffered a violent reversal. As energy demand rebounded post-lockdown, crude prices surged, and tech stocks corrected in 2022, Energy returned +118% over 24 months while the broad S&P fell -18%. Fund managers were forced into the sharpest sector rotation on record to catch benchmark performance. KEY METRICS & HIGHLIGHTS: • 1980 Peak Allocation: 28.2% S&P 500 Weight (#1 Sector in Global Portfolios) • 2020 Historical Trough: 1.9% S&P 500 Weight (All-time low reached in October 2020) • 40-Year Drop (1980–2020): -26.3 Percentage Points (Systematic divestment) • 2021–2022 Relative Outperformance: +118% (Steepest 2-year relative rally on record)