
Where Data Tells the Story
© Voronoi 2026. All rights reserved.

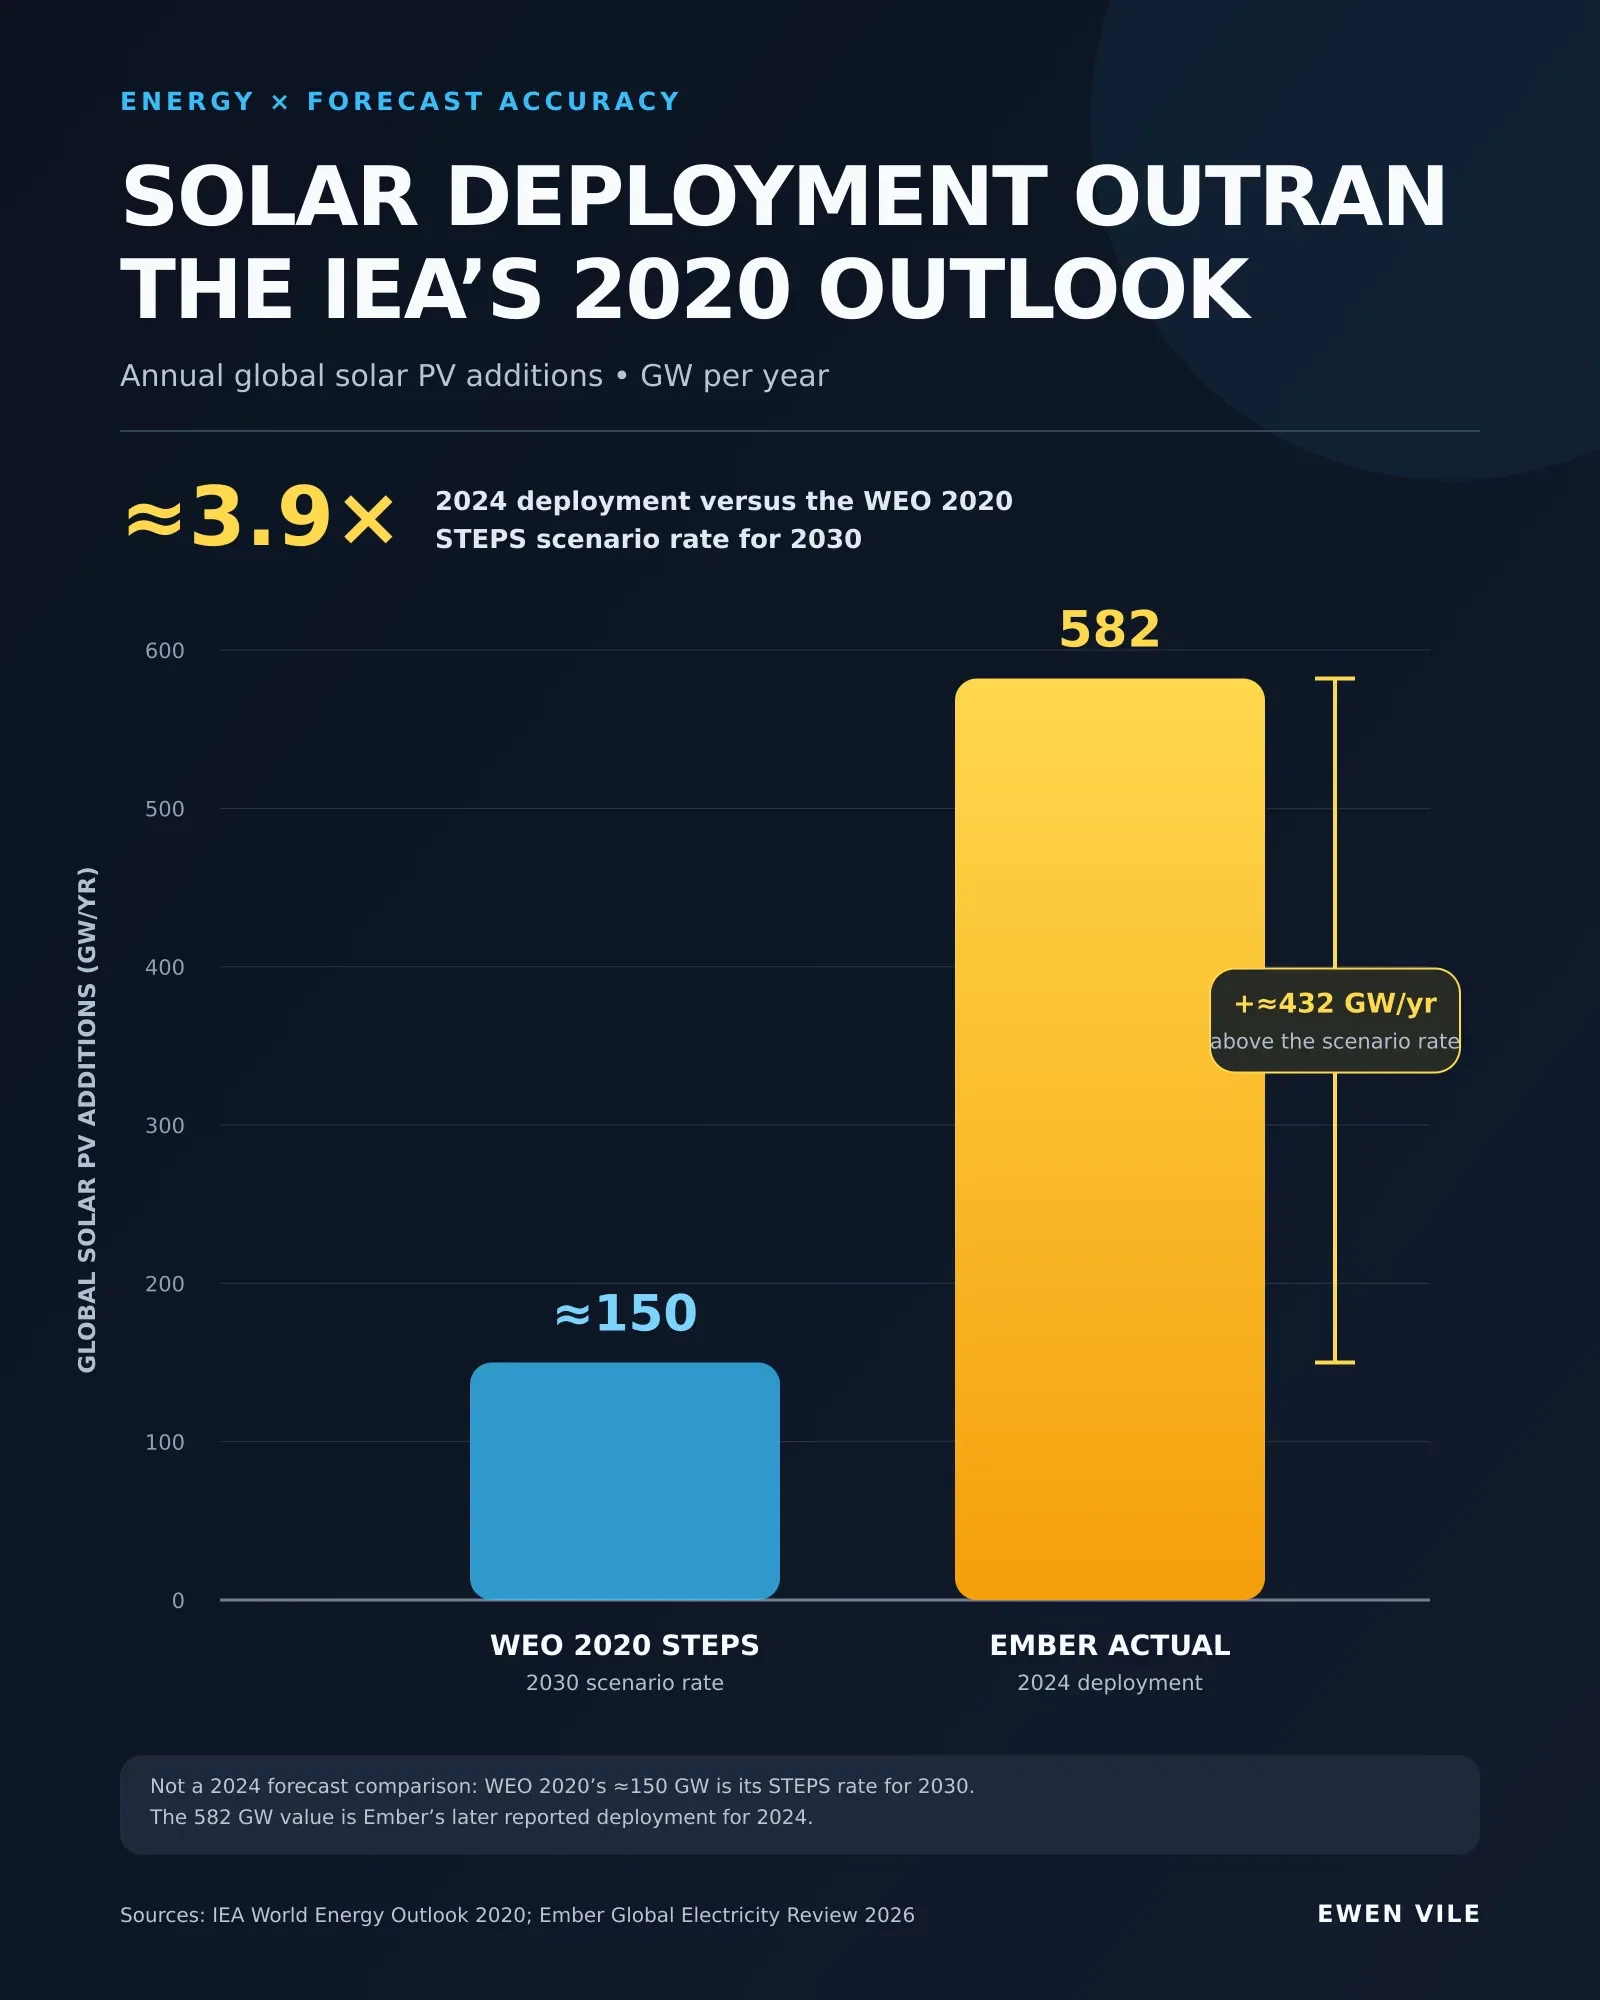
Solar deployment moved much faster than the International Energy Agency’s 2020 outlook implied. In the World Energy Outlook 2020 Stated Policies Scenario, annual global solar PV additions in 2030 were plotted at about 150 GW. Ember’s later reported figure for 2024 was 582 GW—roughly 3.9 times the WEO 2020 scenario rate, reached six years earlier than the scenario’s reference year.

The gap is about 432 GW of additions per year. This does not mean the IEA issued a literal forecast of 150 GW for 2024: the comparison is between a 2030 scenario rate published in 2020 and observed deployment in 2024. WEO scenarios are conditional pathways based on policy and market assumptions, not unconditional predictions.

The older graphic has been corrected: 590 GW was not a verified actual. Ember estimated 593 GW before the end of 2024 and later reported 582 GW. IRENA reports a lower 451.9 GW net-capacity increase because its series and measurement basis differ; those figures are not mixed here. The WEO value is shown as approximate because it is read from Figure 1.4 rather than a printed data table.