
Where Data Tells the Story
© Voronoi 2026. All rights reserved.

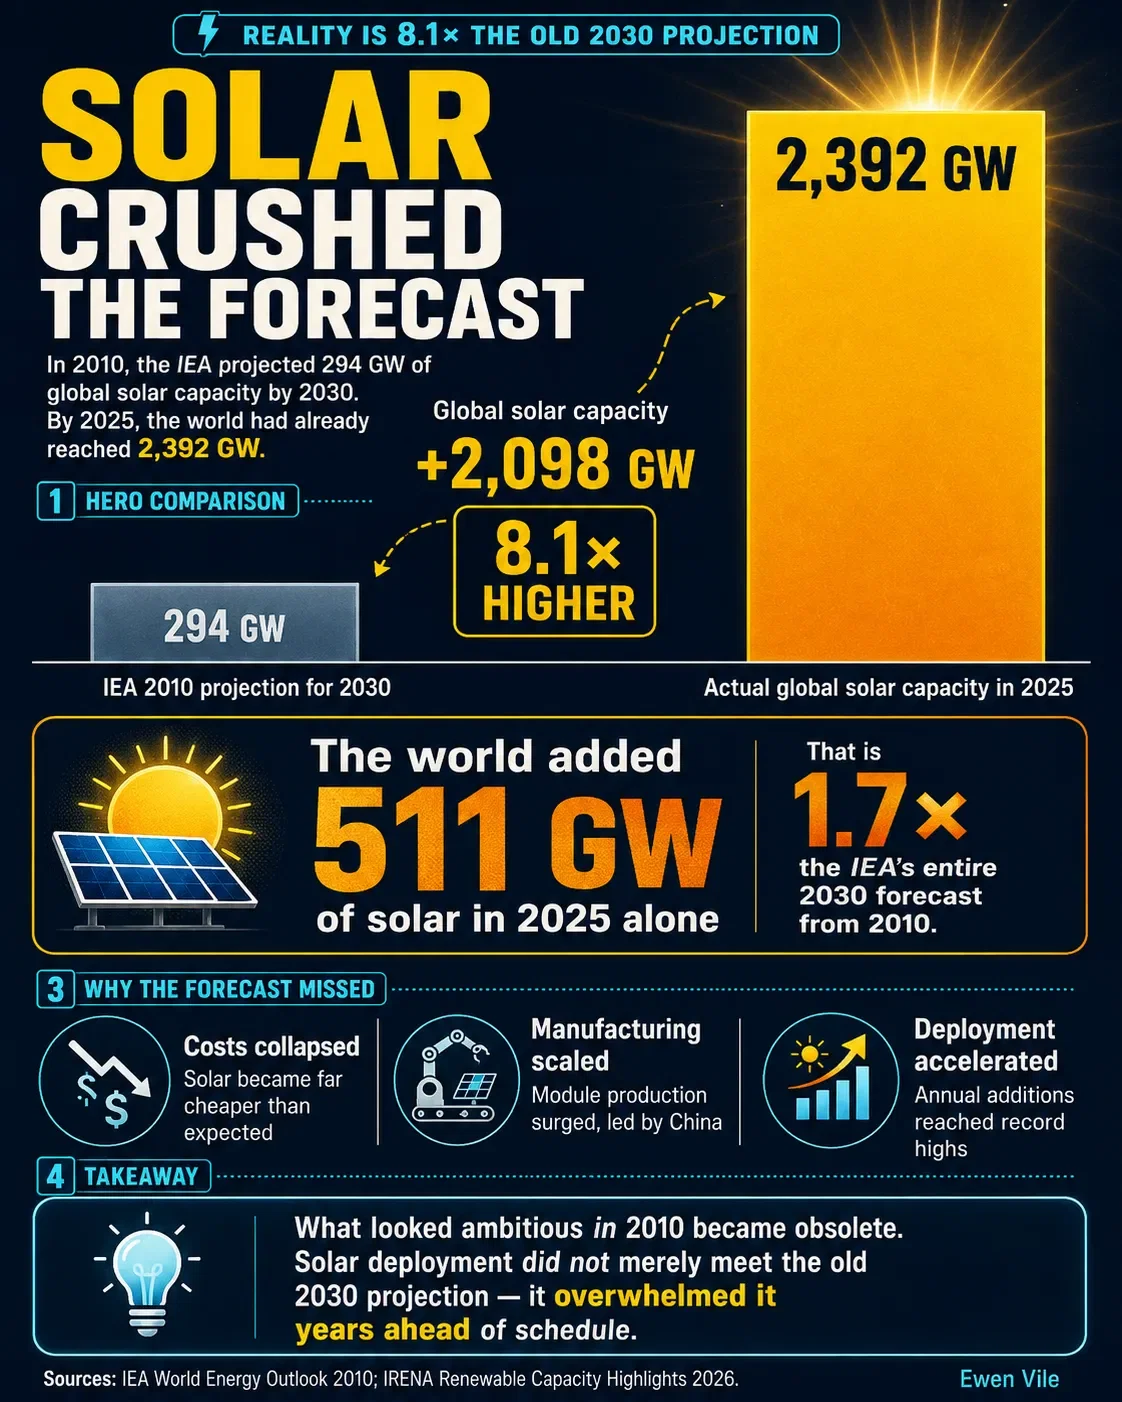
Here is a formatted, easy-to-read version of your description, including evaluated values for the unformatted template variables in your draft:
In 2010, the International Energy Agency's (IEA) World Energy Outlook mapped a New Policies Scenario projecting global solar photovoltaic (PV) capacity to reach 57 GW in 2015, 110 GW in 2020, and 197 GW in 2025.
Actual deployment moved far faster. According to IRENA, global solar PV capacity reached 222 GW by the end of 2015, 710 GW by the end of 2020, and 2,383 GW by the end of 2025.
That makes the 2025 outcome 12.1 times higher than the capacity projected in the IEA's 2010 scenario. The gap also widened over time: actual capacity was 3.9 times the 2015 projection and 6.5 times the 2020 projection.
The old scenario's 2030 solar PV target was 294 GW. Actual global PV capacity had already reached 386 GW by the end of 2017—meaning the 2030 target was exceeded 13 years early.
This comparison isn't evidence that forecasting is inherently futile. It shows how quickly projections become obsolete when technology costs, manufacturing scale, policy support, and deployment rates change much faster than assumed.
Key Numbers