Where Data Tells the Story
© Voronoi 2026. All rights reserved.

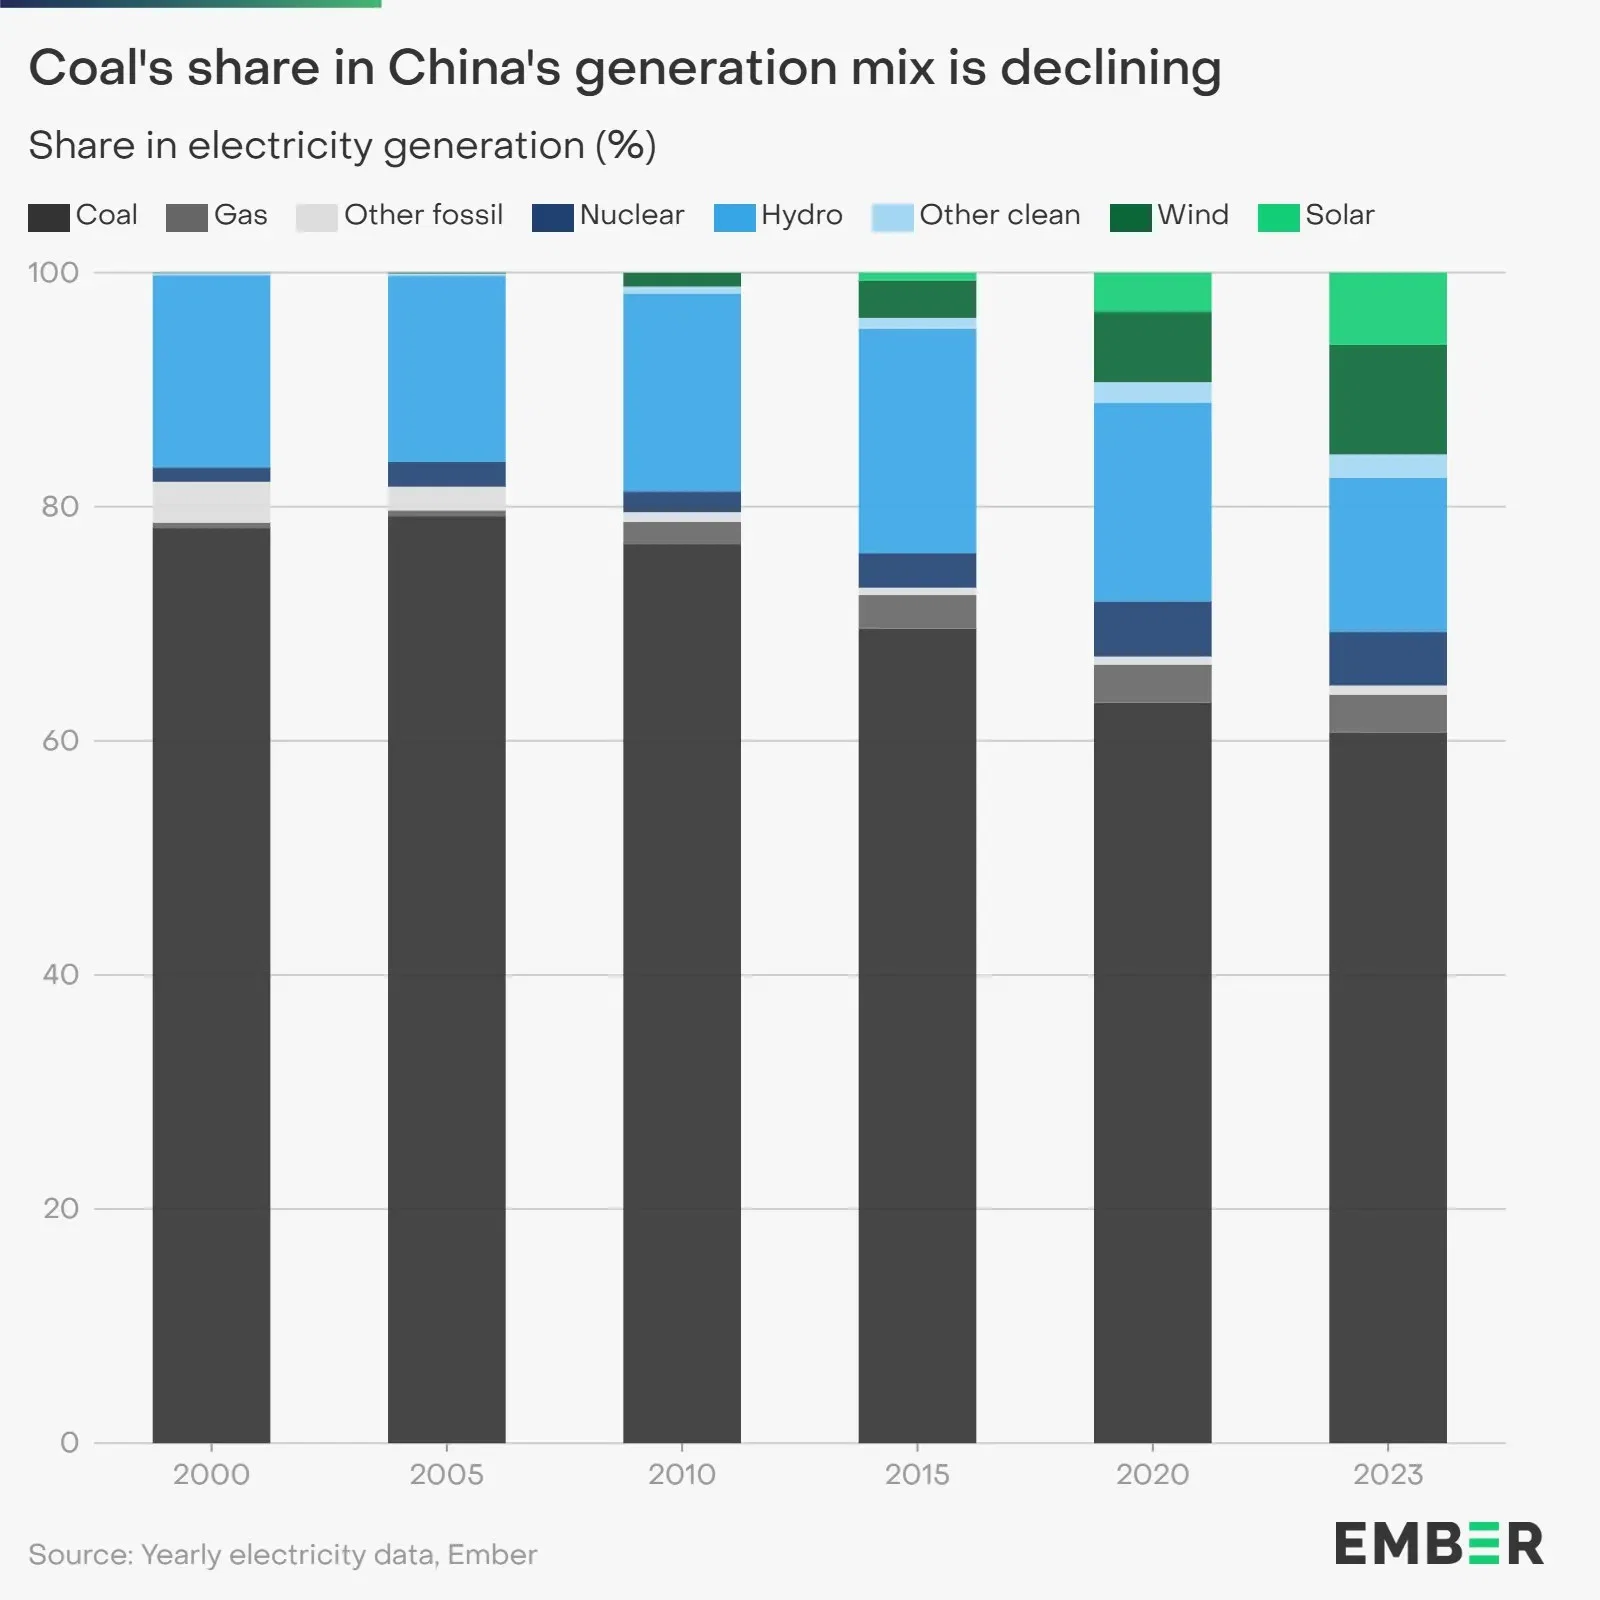
Coal power in China has seen a relative decline, dropping from over 70% in the mid-2000s, to about 60% in 2023. This trend is largely driven by the rapid expansion of non-fossil generation, particularly from renewable energy sources.
Since 2020, the total capacity of non-fossil fuel generation in China, led by wind and solar, has increased by about 60%, rising from about 980 GW in 2020 to over 1,570 GW in 2023. In 2023, non-fossil fuel generation capacity surpassed that of thermal capacity for the first time, constituting more than half of the country’s total installed capacity. Meanwhile, the share of coal capacity has dropped below 40%.
It is also worth noting that distributed solar capacity has experienced a substantial increase, growing from 3 GW in 2013 to over 250 GW in 2023. In 2023, over one-third of the total solar capacity added came from distributed systems.
China’s rapid build-up of renewable energy capacity has resulted in less coal in the generation mix. In 2000, only 18% of China’s electricity came from non-fossil energy sources. By 2023, the share has doubled to 35%. Most of the growth in the share of non-fossil fuel generation occurred in recent years, primarily due to a rapid addition of wind and solar. Indeed, the combined share of wind and solar generation grew from about 4% in 2015 to almost 16% in 2023. In 2023, wind and solar together produced more electricity than hydro for the first time.