Where Data Tells the Story
© Voronoi 2025. All rights reserved.

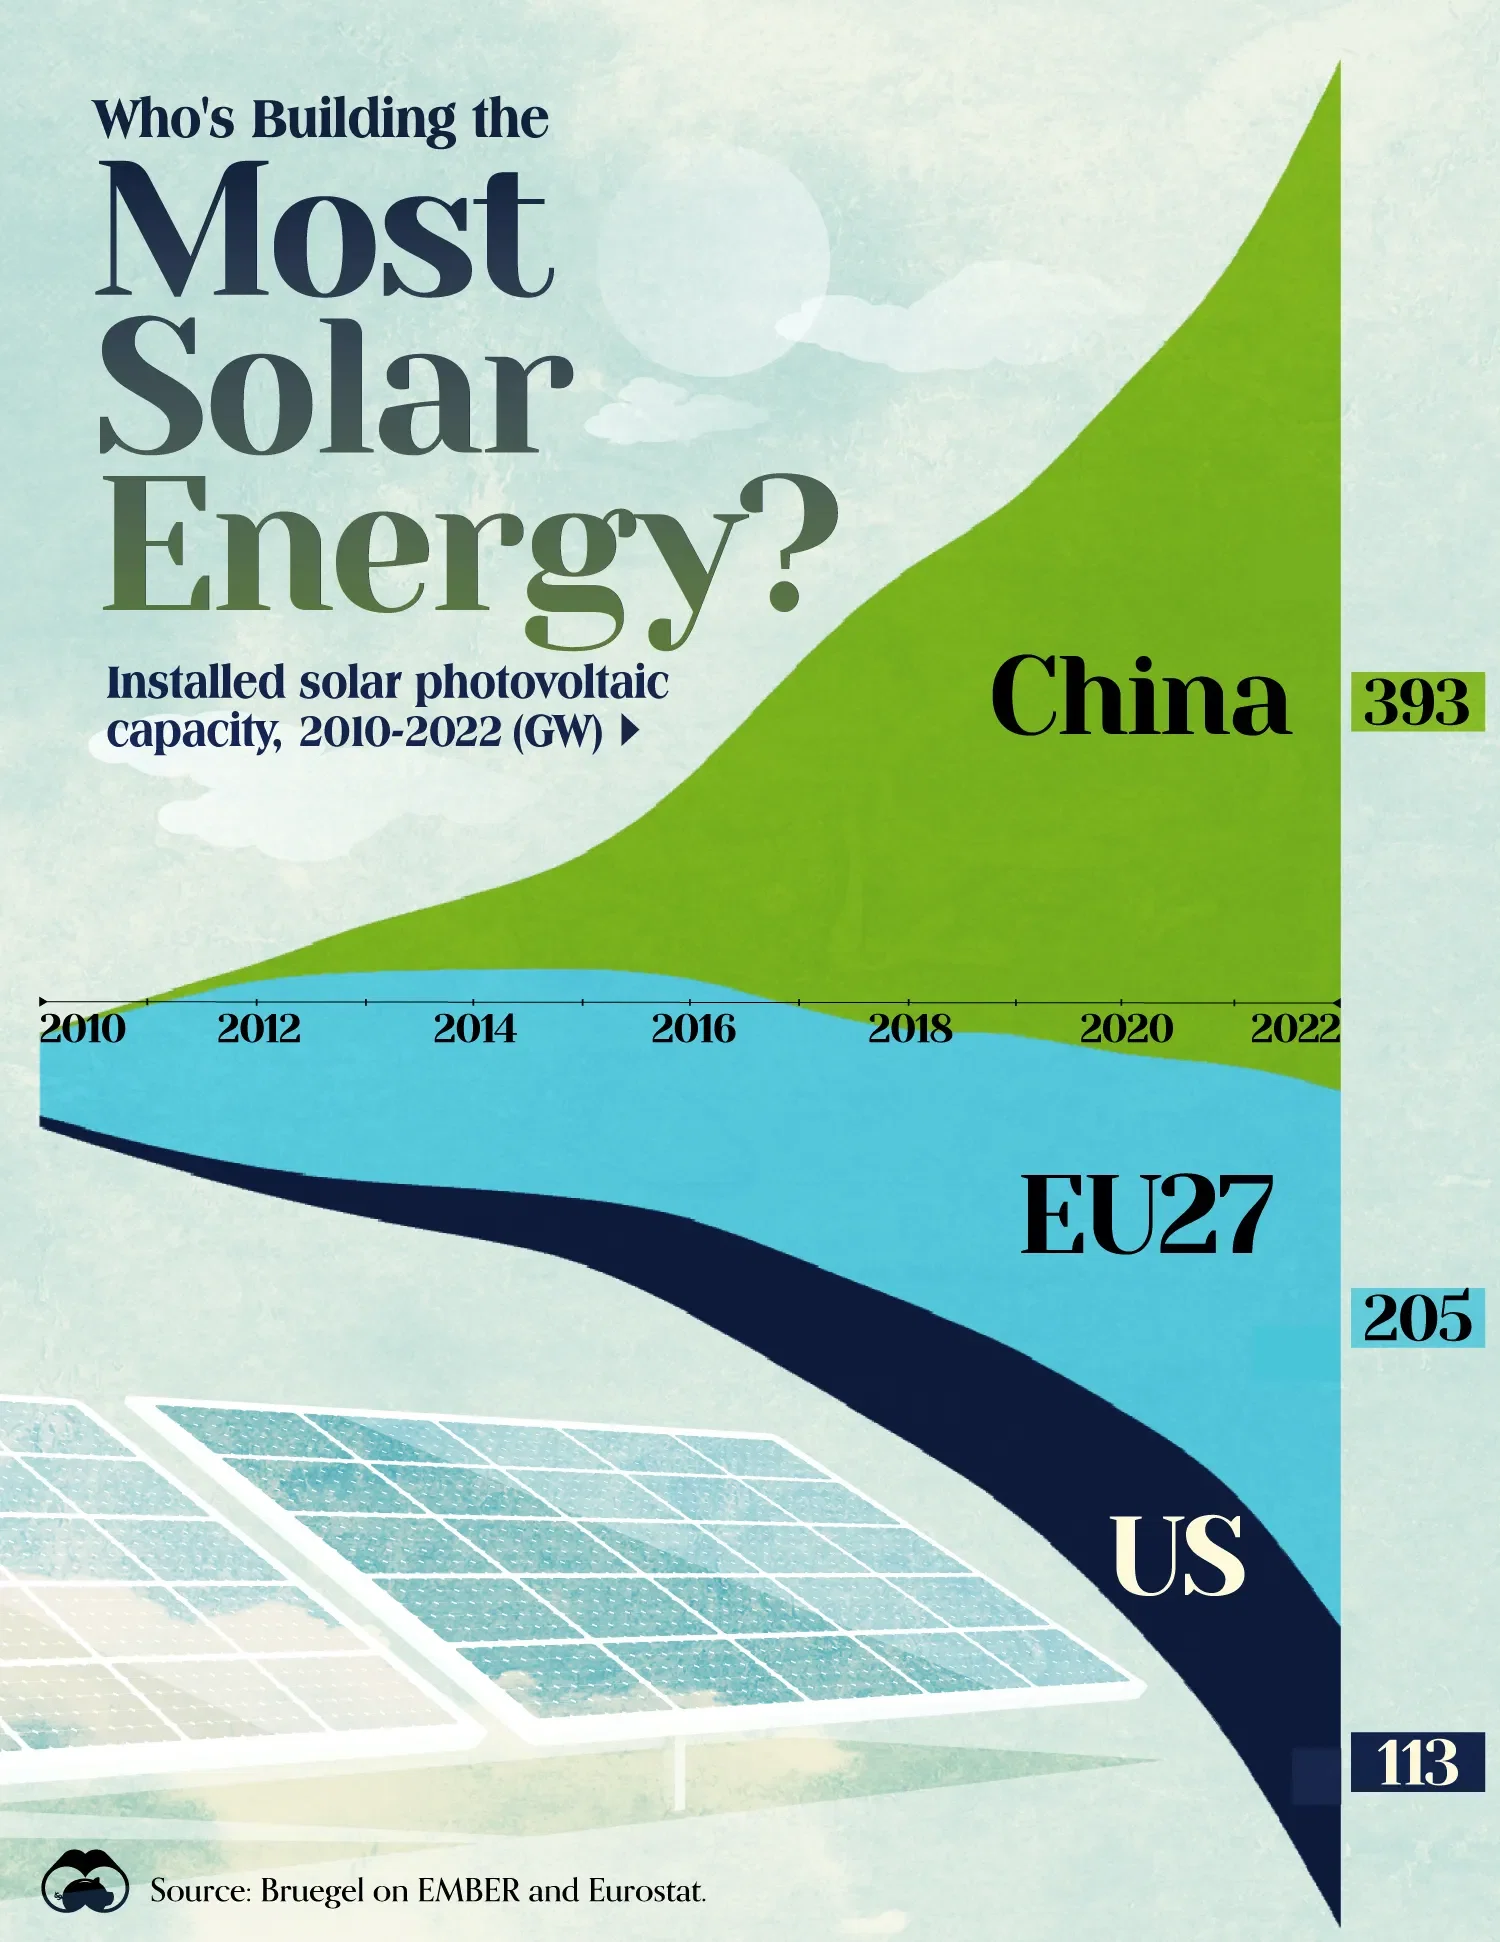
Installed solar photovoltaic (PV) capacity in China, the EU, and the U.S. between 2010 and 2022, measured in gigawatts (GW).
As of 2022, China's total installed capacity stands at 393 GW, nearly double the EU's 205 GW, and surpassing the USA's total of 113 GW by more than threefold in absolute terms.
Since 2017, China has shown a compound annual growth rate (CAGR) of approximately 25% in installed PV capacity, while the USA has seen a CAGR of 21%, and the EU of 16%.