Where Data Tells the Story
© Voronoi 2026. All rights reserved.

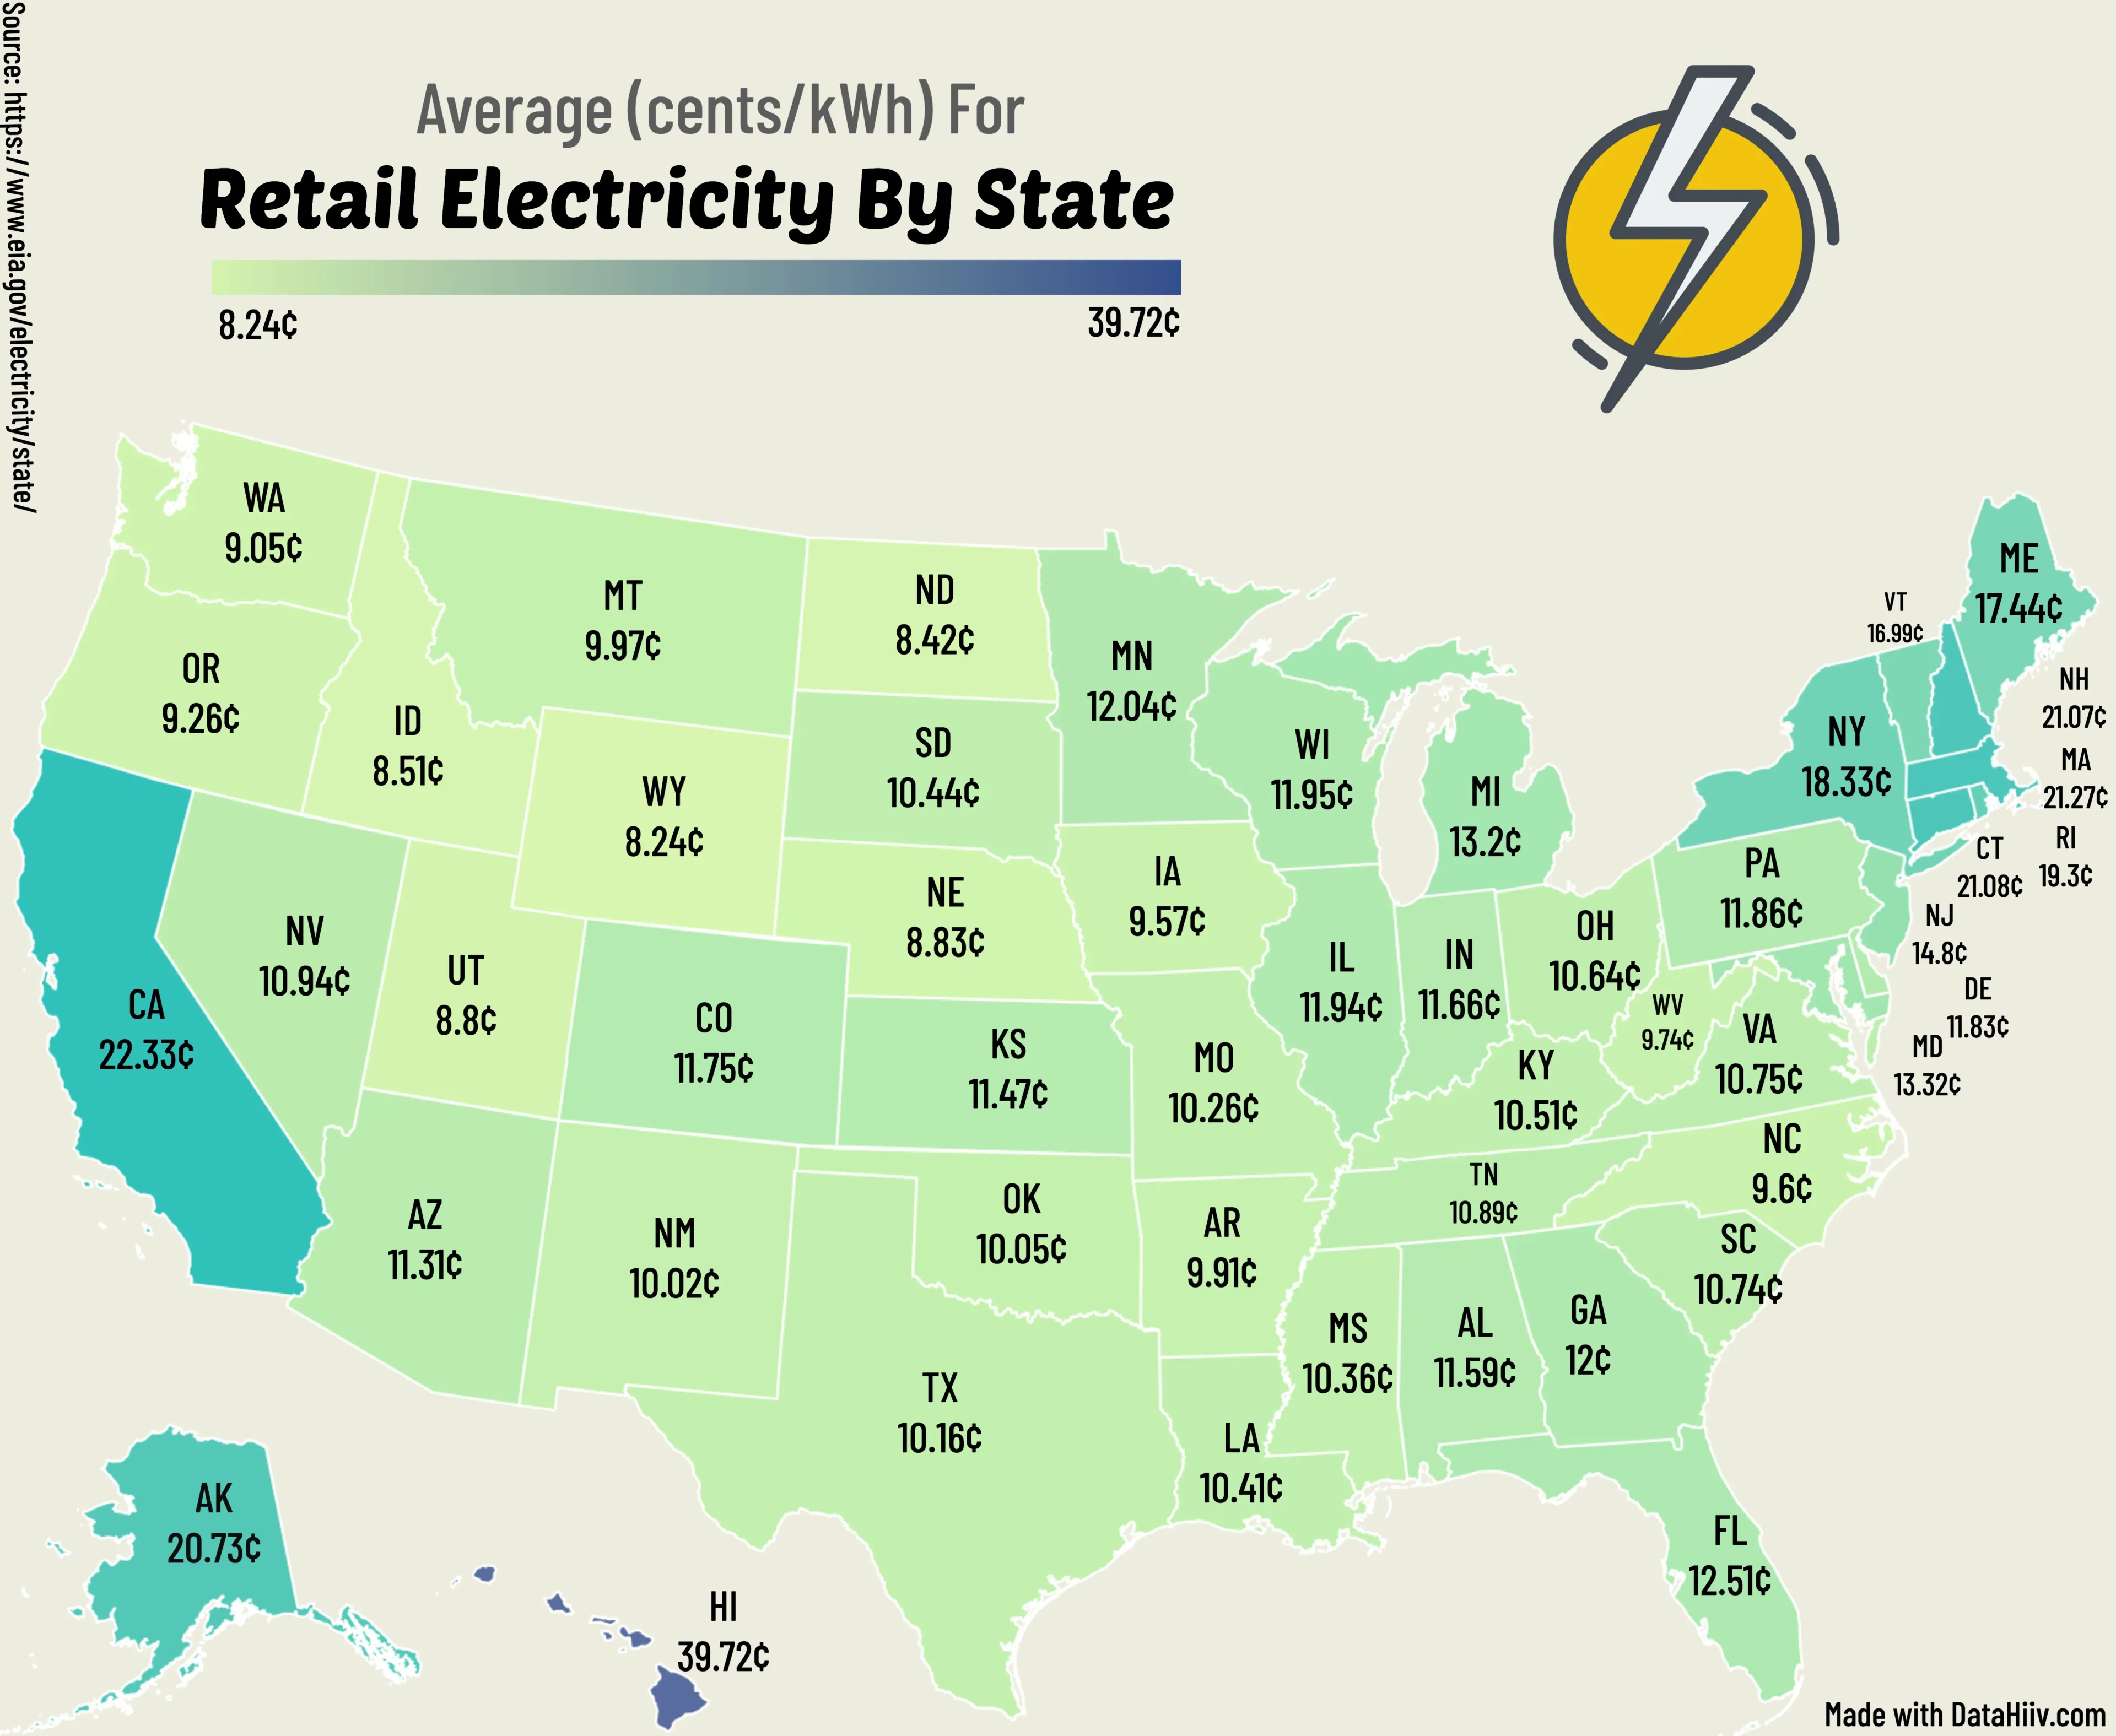
The infographic presents a detailed overview of the average retail electricity prices across the United States, measured in cents per kilowatt-hour (kWh). The data highlights significant variations in electricity costs from state to state, offering insights into regional differences in energy pricing. The map is color-coded to visually distinguish between states with lower and higher electricity prices, providing a clear and accessible means of comparison.
California, with an average electricity price of 22.33 cents/kWh, stands out as one of the states with the highest electricity costs. This is contrasted sharply with states like Wyoming and North Dakota, where electricity prices are considerably lower at 8.24 cents/kWh. This stark difference emphasizes the economic disparities in energy costs that can impact both residents and businesses depending on their geographic location.
The Northeast region, including states like New York (18.33 cents/kWh), Connecticut (21.08 cents/kWh), and Massachusetts (21.27 cents/kWh), generally experiences higher electricity prices compared to the Midwest and Southern states. For instance, states such as Texas (10.16 cents/kWh), Georgia (12 cents/kWh), and Florida (12.51 cents/kWh) maintain more moderate electricity rates, making energy more affordable for their populations.
Hawaii, depicted with a notably darker shade, has the highest electricity rate in the country at 39.72 cents/kWh. This extreme cost is due to the state's reliance on imported fossil fuels and its isolated location, which complicates energy production and distribution. Alaska also features higher rates at 20.73 cents/kWh, reflecting similar logistical and environmental challenges.
This infographic not only serves as an informative resource for understanding the current landscape of electricity pricing in the U.S. but also underscores the broader implications of these rates. High electricity costs can affect everything from household budgets to the operational expenses of businesses, influencing economic decisions and policy-making at state and local levels. By illustrating these differences, the map provides a foundation for discussions on energy policy, infrastructure investments, and sustainable energy solutions.