EconomyJul 11, 2024
The G7’s Share of Global GDP is Shrinking
What We’re Showing
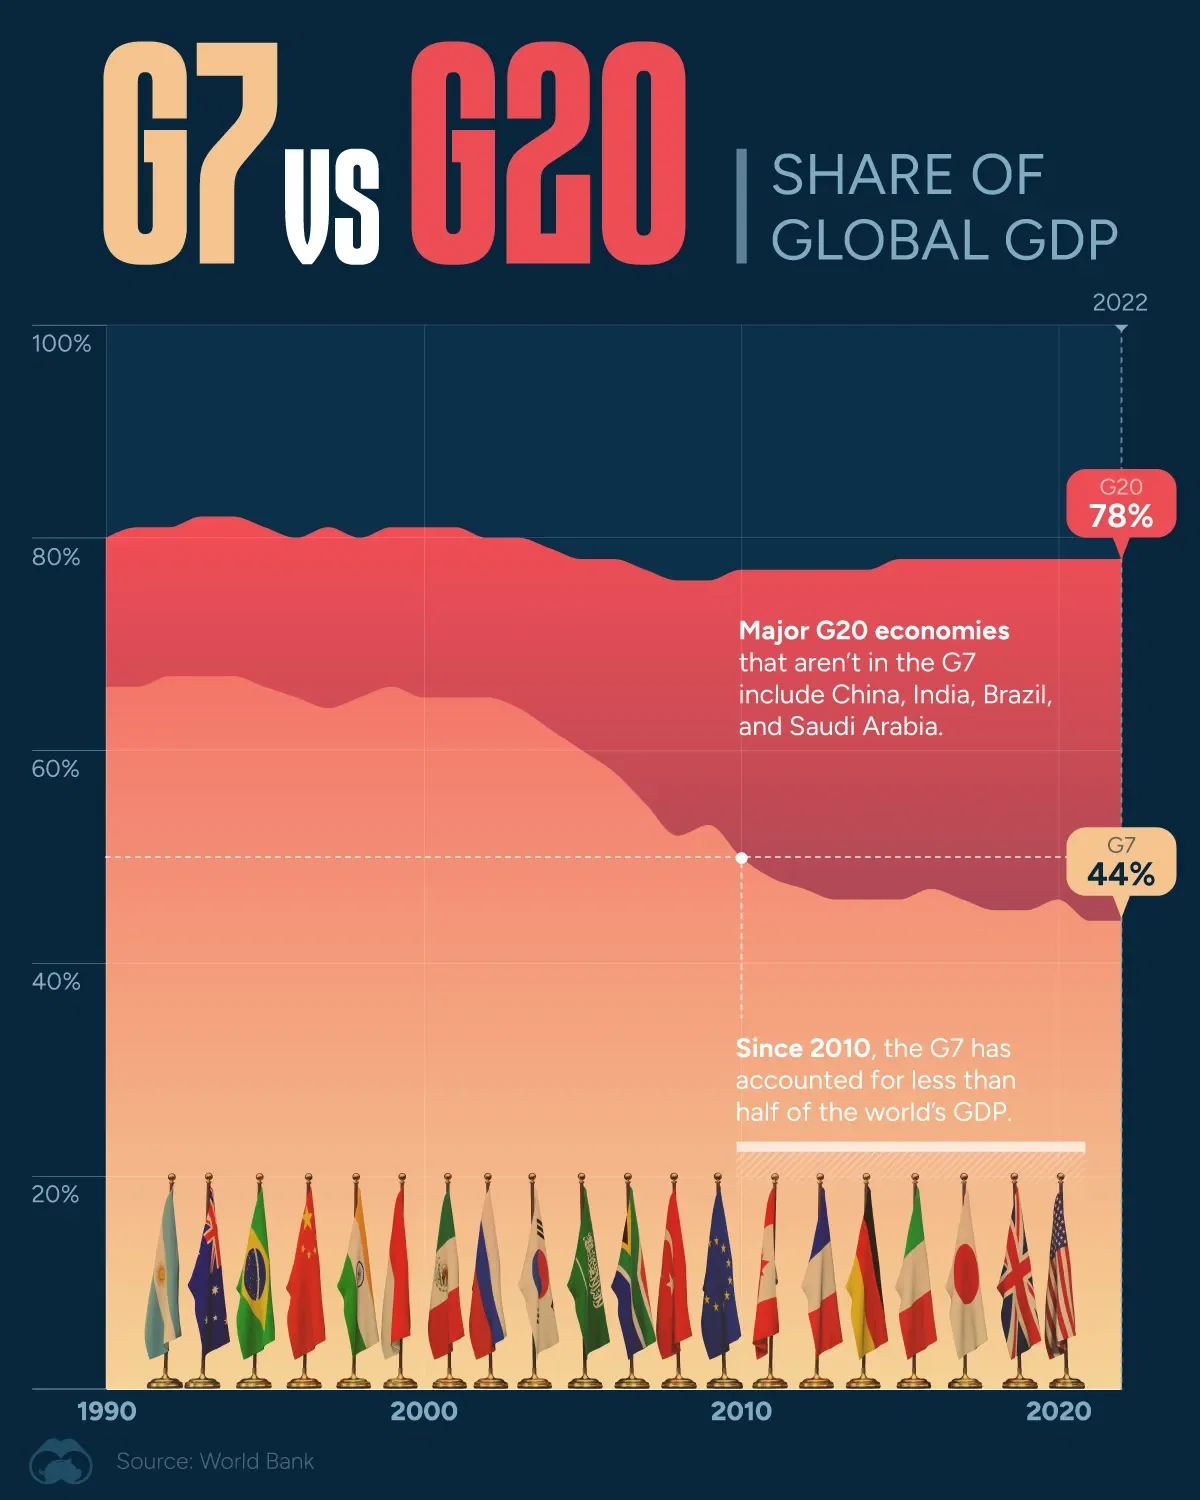
This chart shows historical % share of GDP for both the G7 and G20. Figures come from the World Bank, accessed via the Council on Foreign Relations.
G7 vs G20: What’s the Difference?
- The G7 is a group of seven advanced economies (U.S., Canada, UK, Germany, France, Italy, Japan) formed in 1975
- The G20 is an expanded group that was established in 1999, with the goal of bringing together advanced and emerging economies to promote international cooperation
Key Takeaway
The G7 has seen it’s share of GDP fall as emerging economies, like China and India, have grown massively over the past several decades.
Note, however, that America's share of global GDP has been increasing over the past several years.
Dataset
Year | G7 share of GDP (%) | G20 share of GDP (%) |
---|---|---|
1990 | 66 | 80 |
1991 | 66 | 81 |
1992 | 67 | 81 |
1993 | 67 | 82 |
1994 | 67 | 82 |
1995 | 66 | 81 |
1996 | 65 | 80 |
1997 | 64 | 81 |
1998 | 65 | 80 |
1999 | 66 | 81 |
2000 | 65 | 81 |
2001 | 65 | 81 |
2002 | 65 | 80 |
2003 | 64 | 80 |
2004 | 62 | 79 |
2005 | 60 | 78 |
2006 | 58 | 78 |
2007 | 55 | 77 |
2008 | 52 | 76 |
2009 | 53 | 76 |
2010 | 50 | 77 |
2011 | 48 | 77 |
2012 | 47 | 77 |
2013 | 46 | 77 |
2014 | 46 | 77 |
2015 | 46 | 78 |
2016 | 47 | 78 |
2017 | 46 | 78 |
2018 | 45 | 78 |
2019 | 45 | 78 |
2020 | 46 | 78 |
2021 | 44 | 78 |
2022 | 44 | 78 |
66
0
16.7K